Industry
Viziodata · Utilities
Energy consumption, totalization and availability KPIs.
Context
Utilities
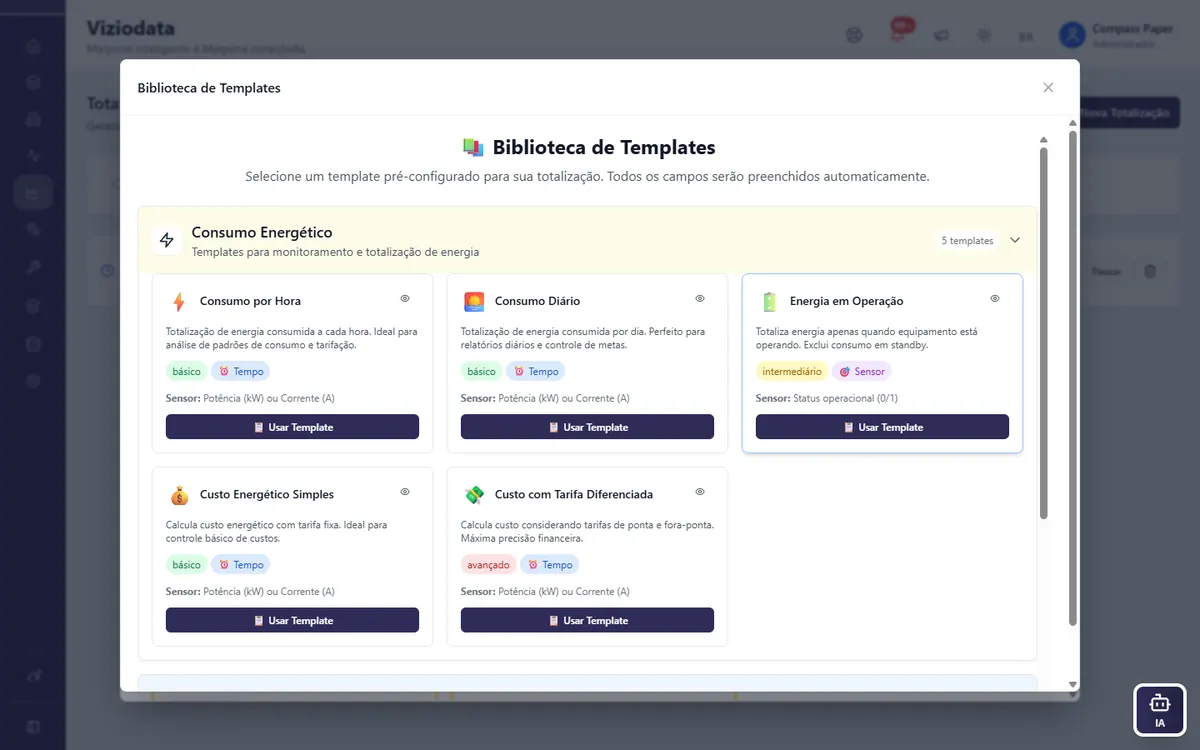
Totalize energy, steam, water and compressed air. Compare sites and shifts and feed sustainability and cost dashboards.
- Totalization of energy and utilities
- Multi-site comparison of specific consumption
- Demand and availability alarms
Typical KPIs
Indicators for this vertical
Recommended applications
Modules that make sense here
Analysis
Dashboards, alarm treemap, trend analyzer, derived points and totalization.
See area →Organizational
Overview, hierarchy and registry of companies, sites, areas, machines and sensors.
See area →Industrial Integration Hub
Connect MQTT, APIs and spreadsheets to your industrial asset data.
See area →Operations
Maintenance engineering, alarms, rationalization, failure analysis, shift log and manual entry.
See area →Case studies
Examples with this area
Industry
Questions about Utilities
Understand the product and the next steps for your operation.
How does Viziodata serve Utilities?
Totalize energy, steam, water and compressed air. Compare sites and shifts and feed sustainability and cost dashboards.
Which use cases in Utilities?
Totalization of energy and utilities Multi-site comparison of specific consumption Demand and availability alarms
Which typical KPIs in Utilities?
Common KPIs: kWh, Energy cost, Availability, Demand peak.