Your industrial integration hub
Monitor your plant.Connect operations and maintenance.
Connect process data, operations and maintenance in one industrial hub. Bring MQTT, API and Excel sources into asset context and use the data in dashboards, alarms and shift logs.
Start with one machine, an area or a challenge for your team.
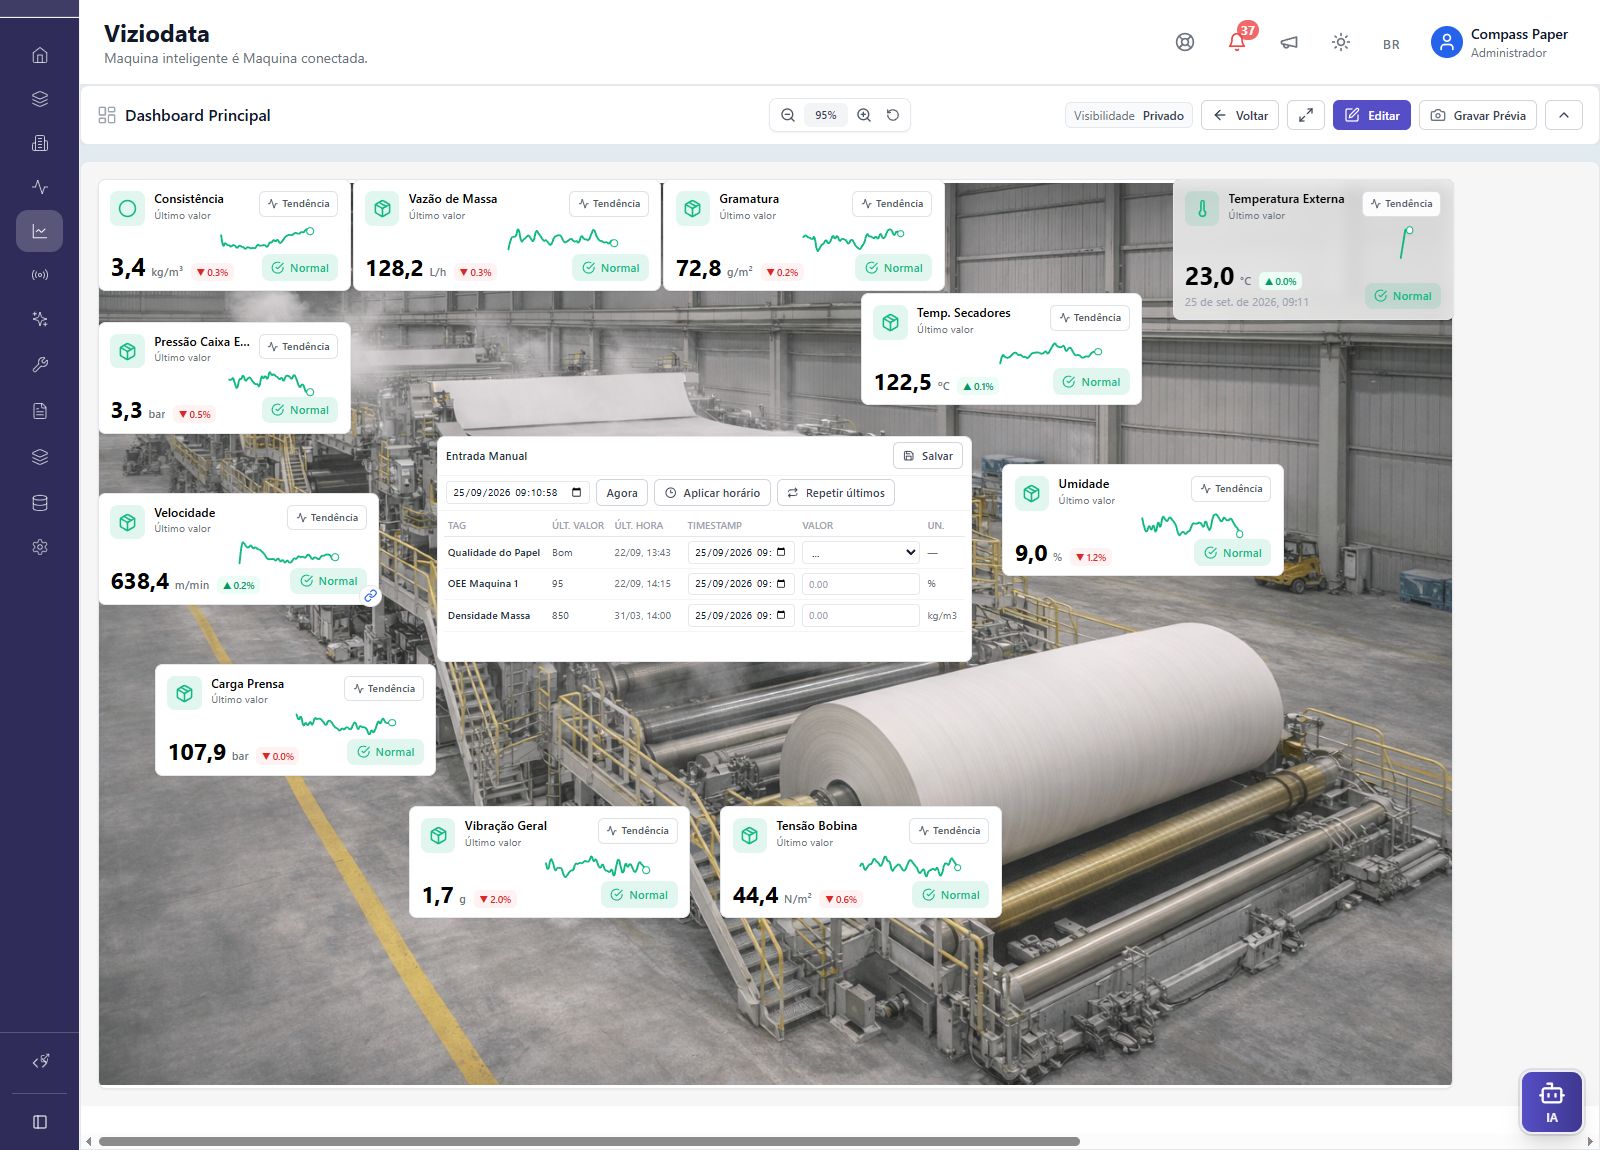
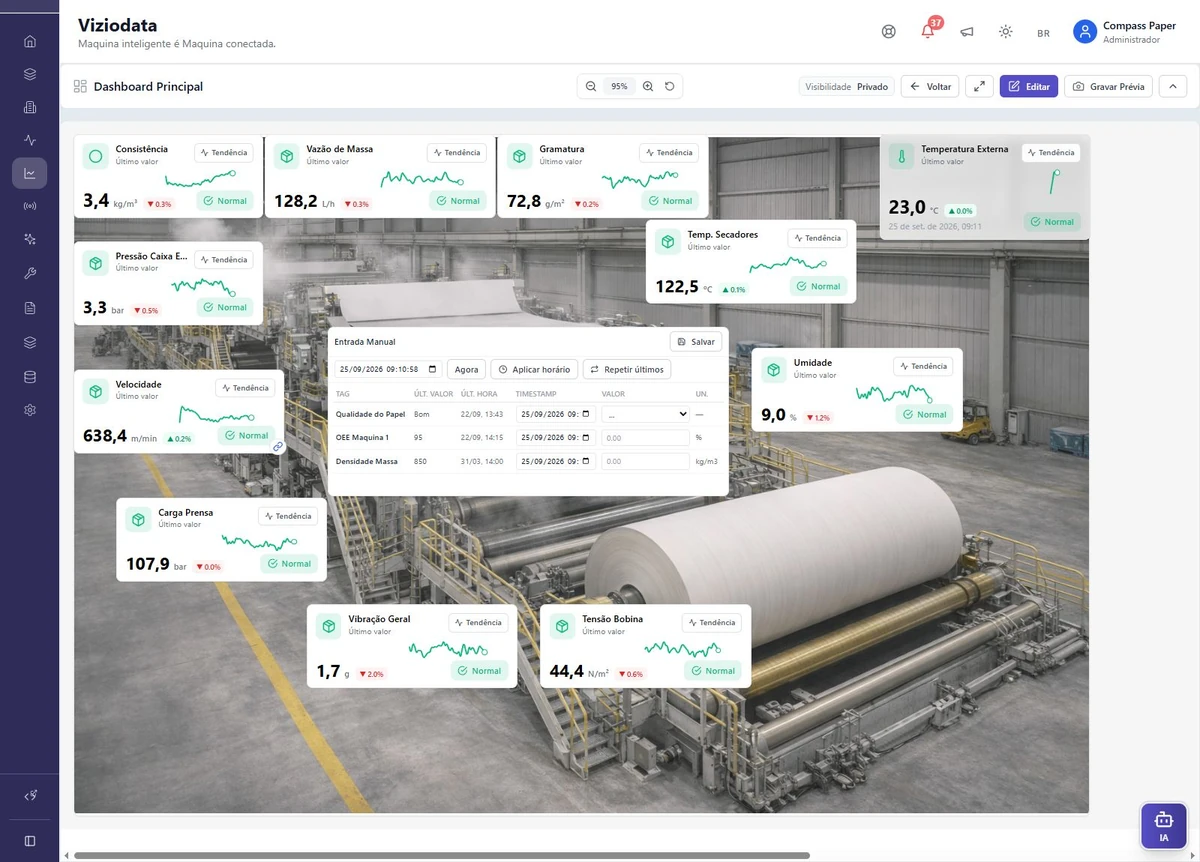
Indicators in the context of the process.
Track speed, basis weight, pressure and other paper machine variables.
Change shifts knowing what still needs attention.
The incoming team finds the event, the machine involved and the maintenance referral, without relying only on a handover conversation.
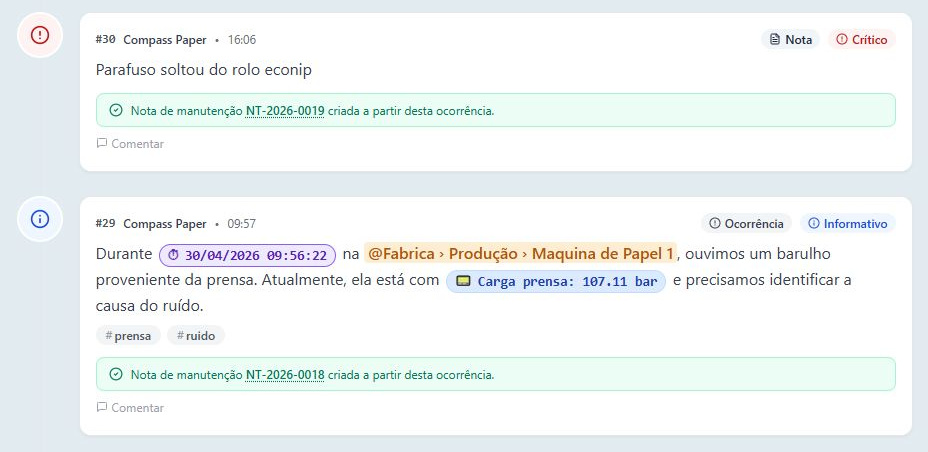
Understand what happened
An event with its time and machine identified.
Check the evidence
The sensor reading recorded alongside the report.
Continue the follow-up
Open the maintenance note linked to the event.
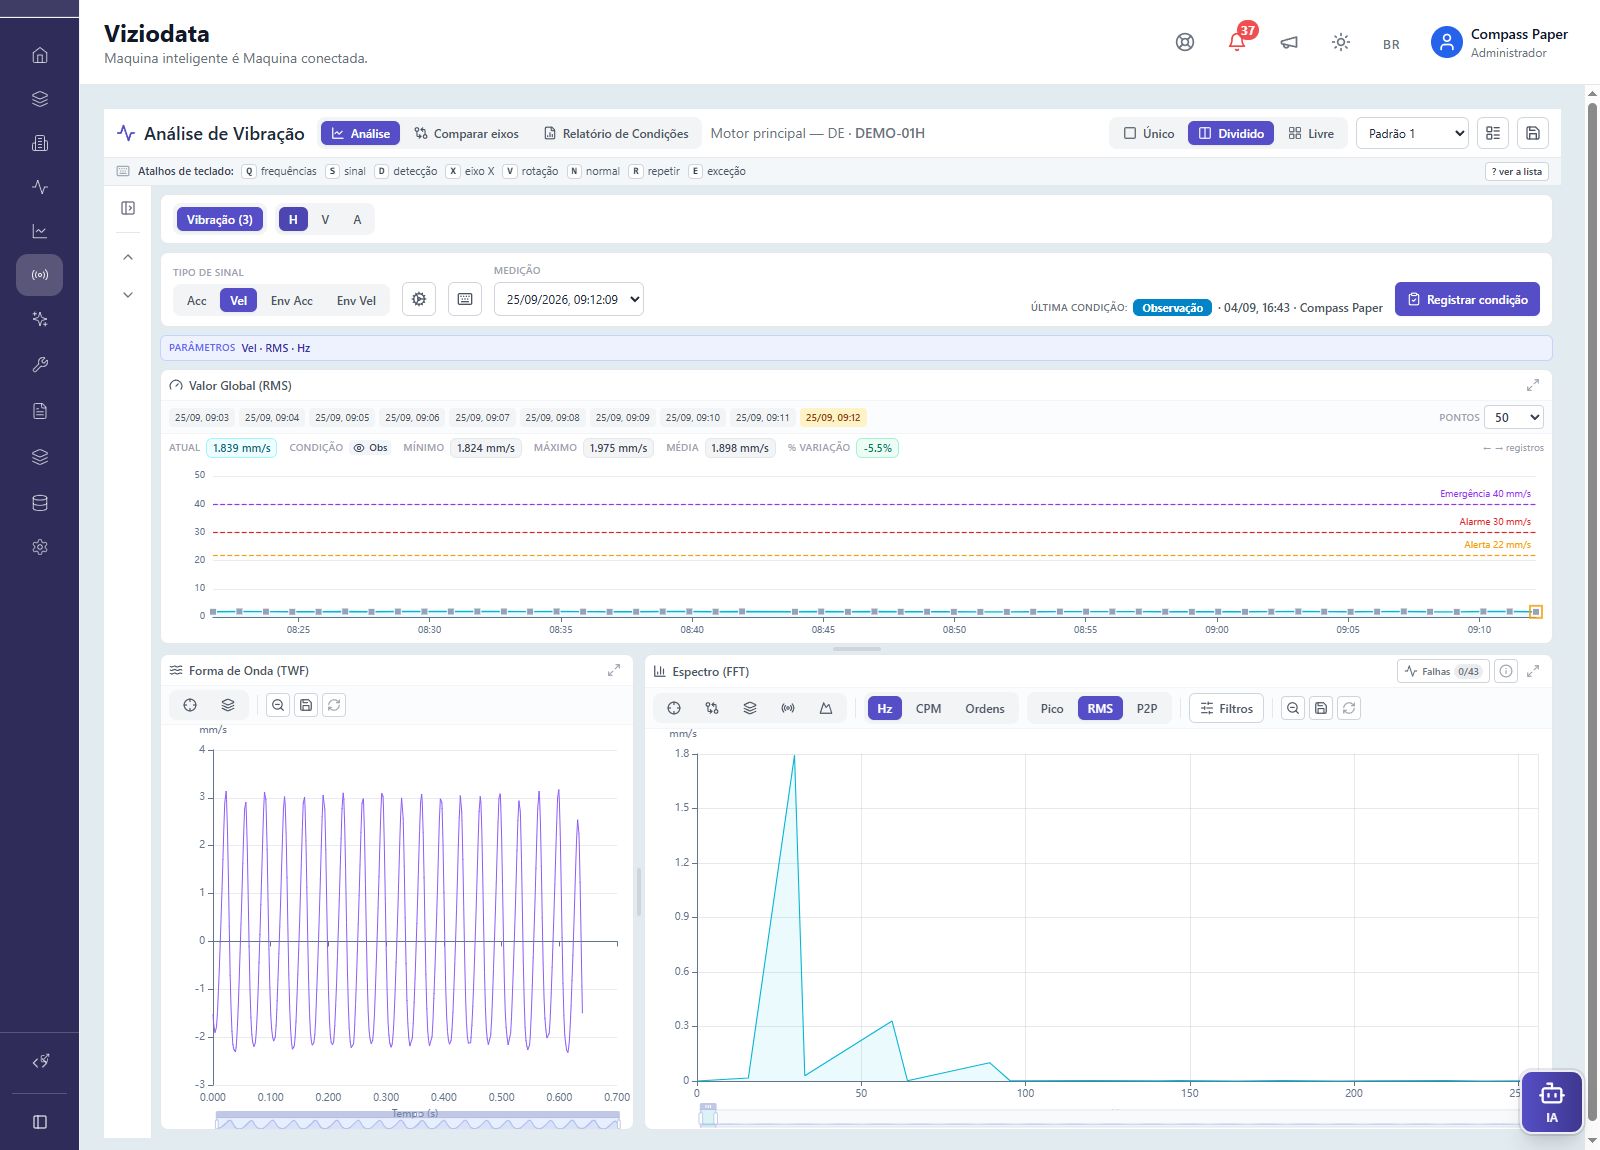
From waveform to vibration spectrum.
Compare measurements and explore frequencies to support asset condition analysis.
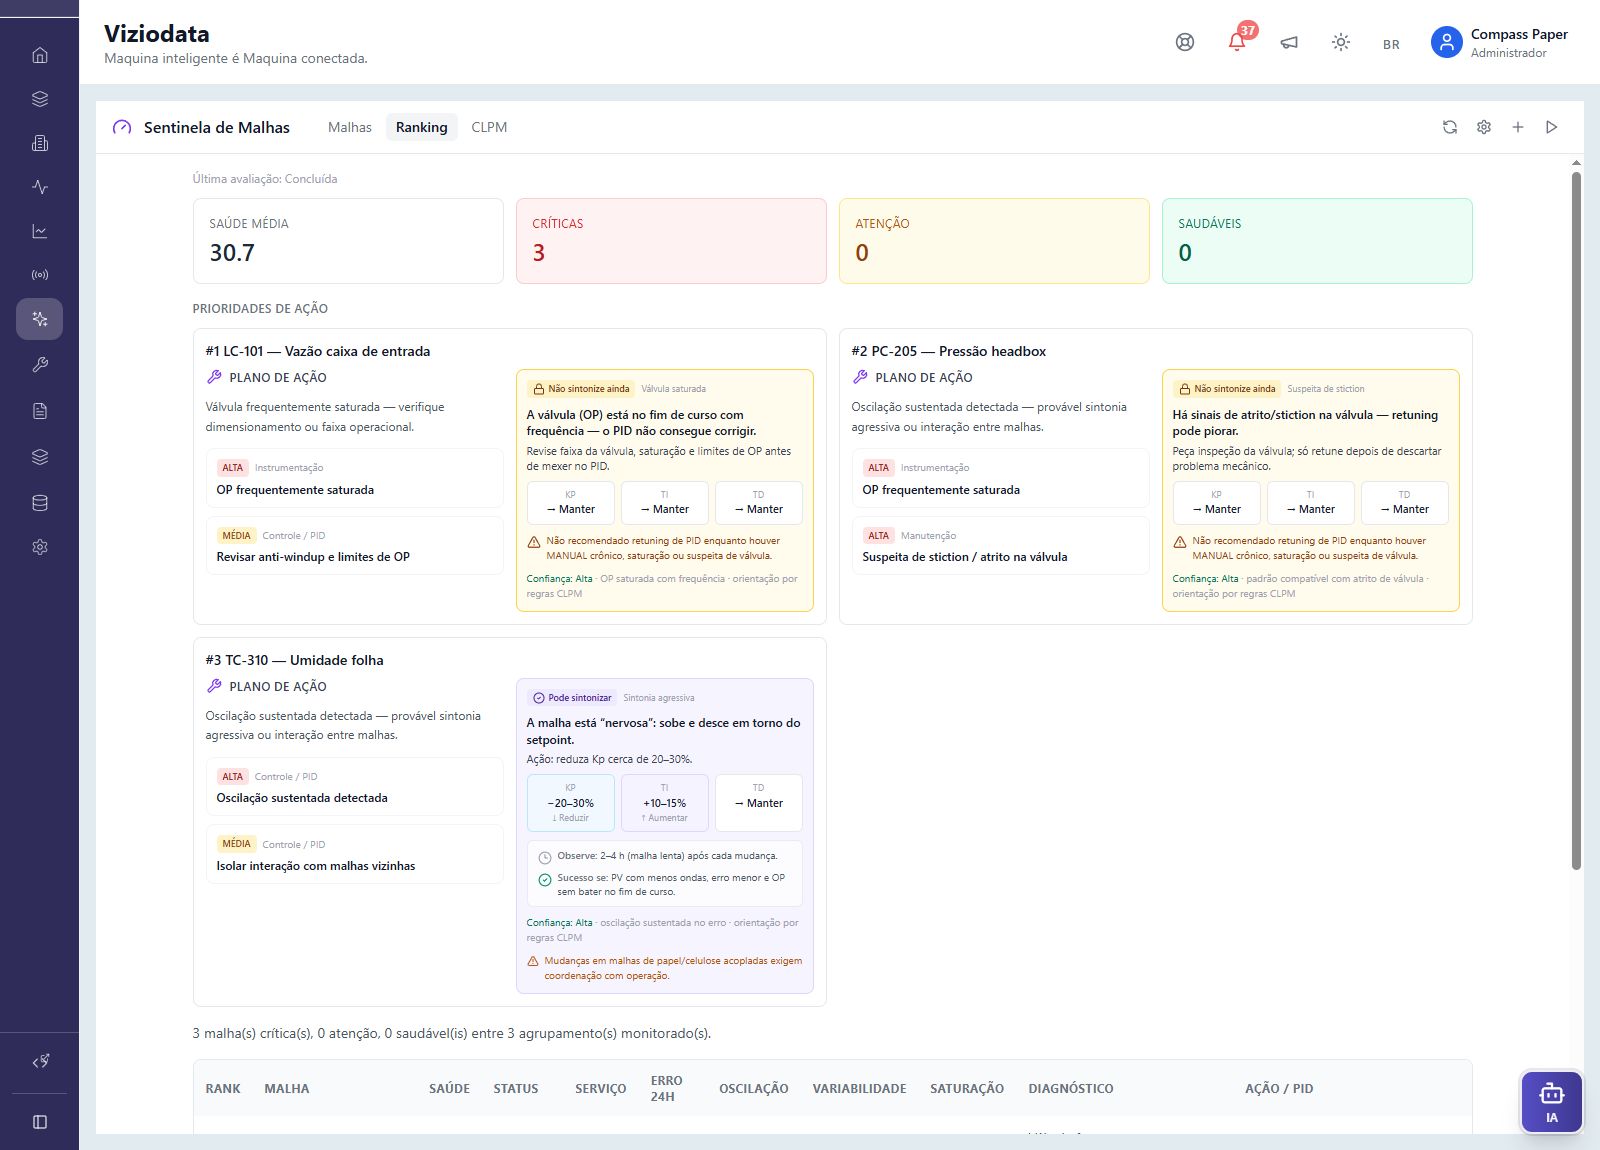
Find the loops that need attention.
Compare health rankings, diagnostics and recommendations for each loop.
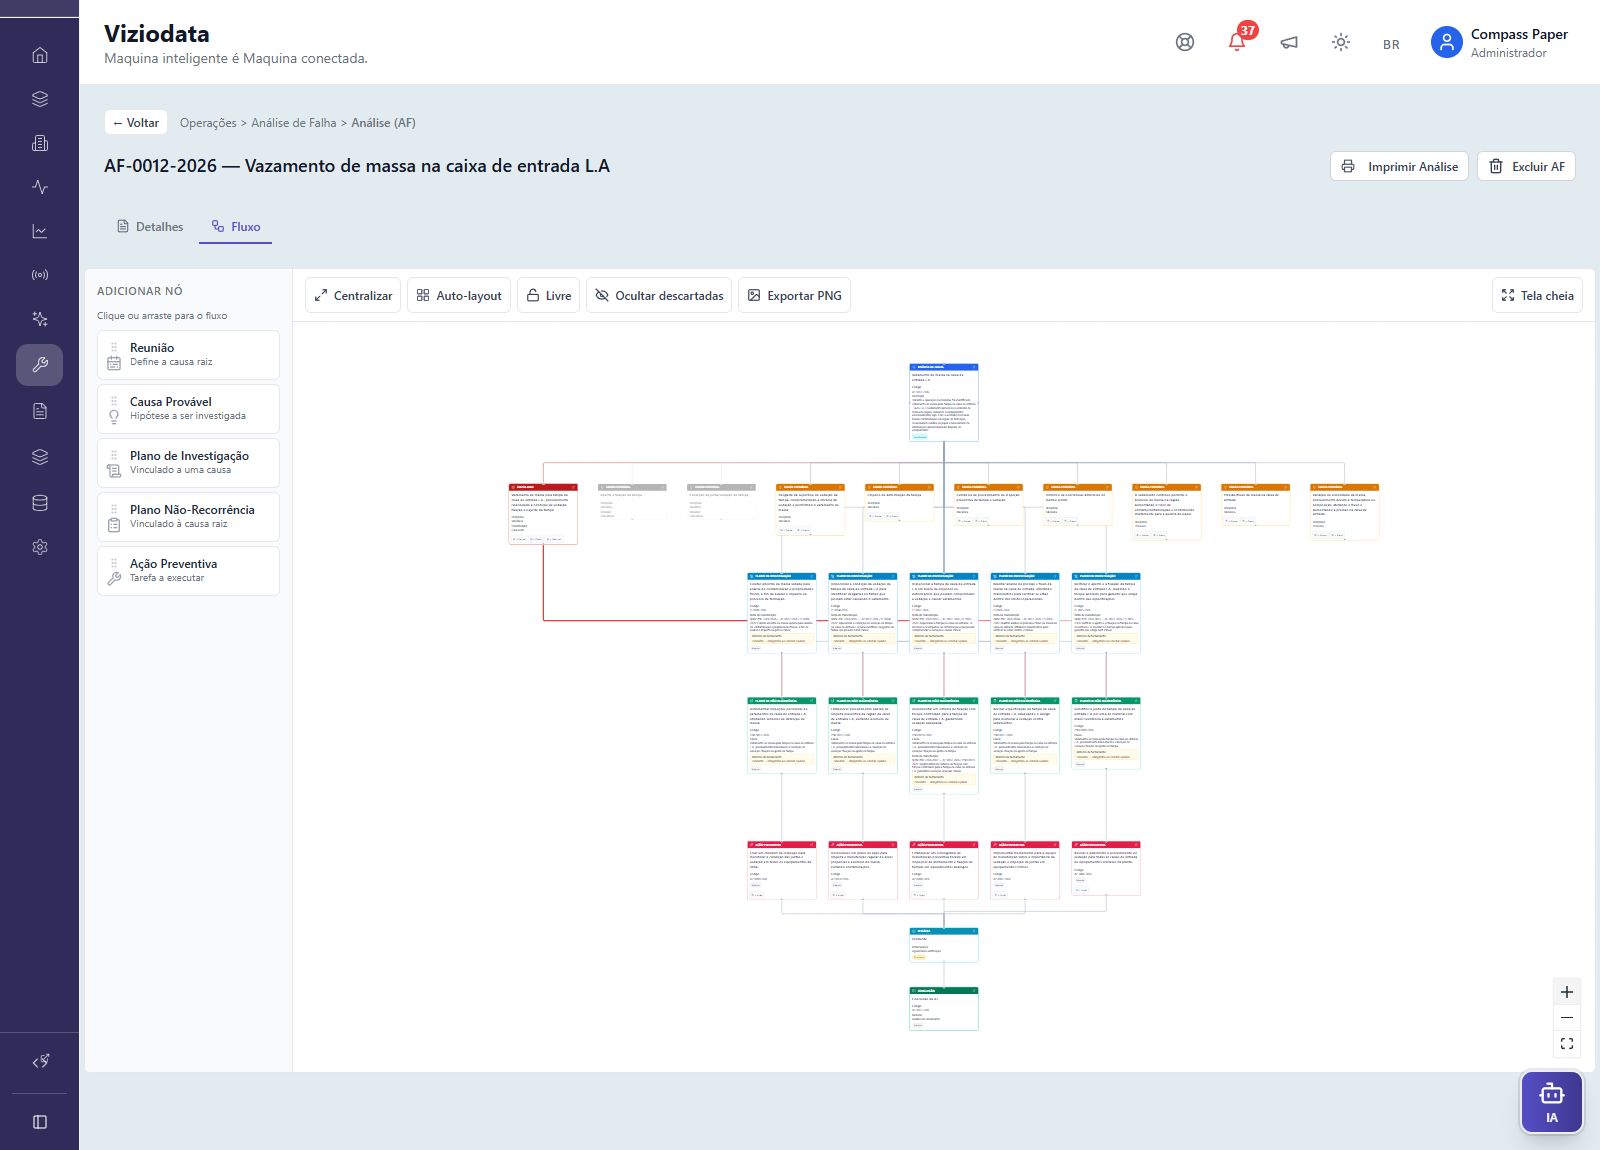
Organize the investigation, from hypothesis to plan.
Connect probable causes, investigations and actions to follow the failure analysis.
See the process
Variables, trends and alarms in the context of each asset.
Preserve the history
Records that follow operations from one shift to the next.
Organize the response
Related causes, investigations and action plans.
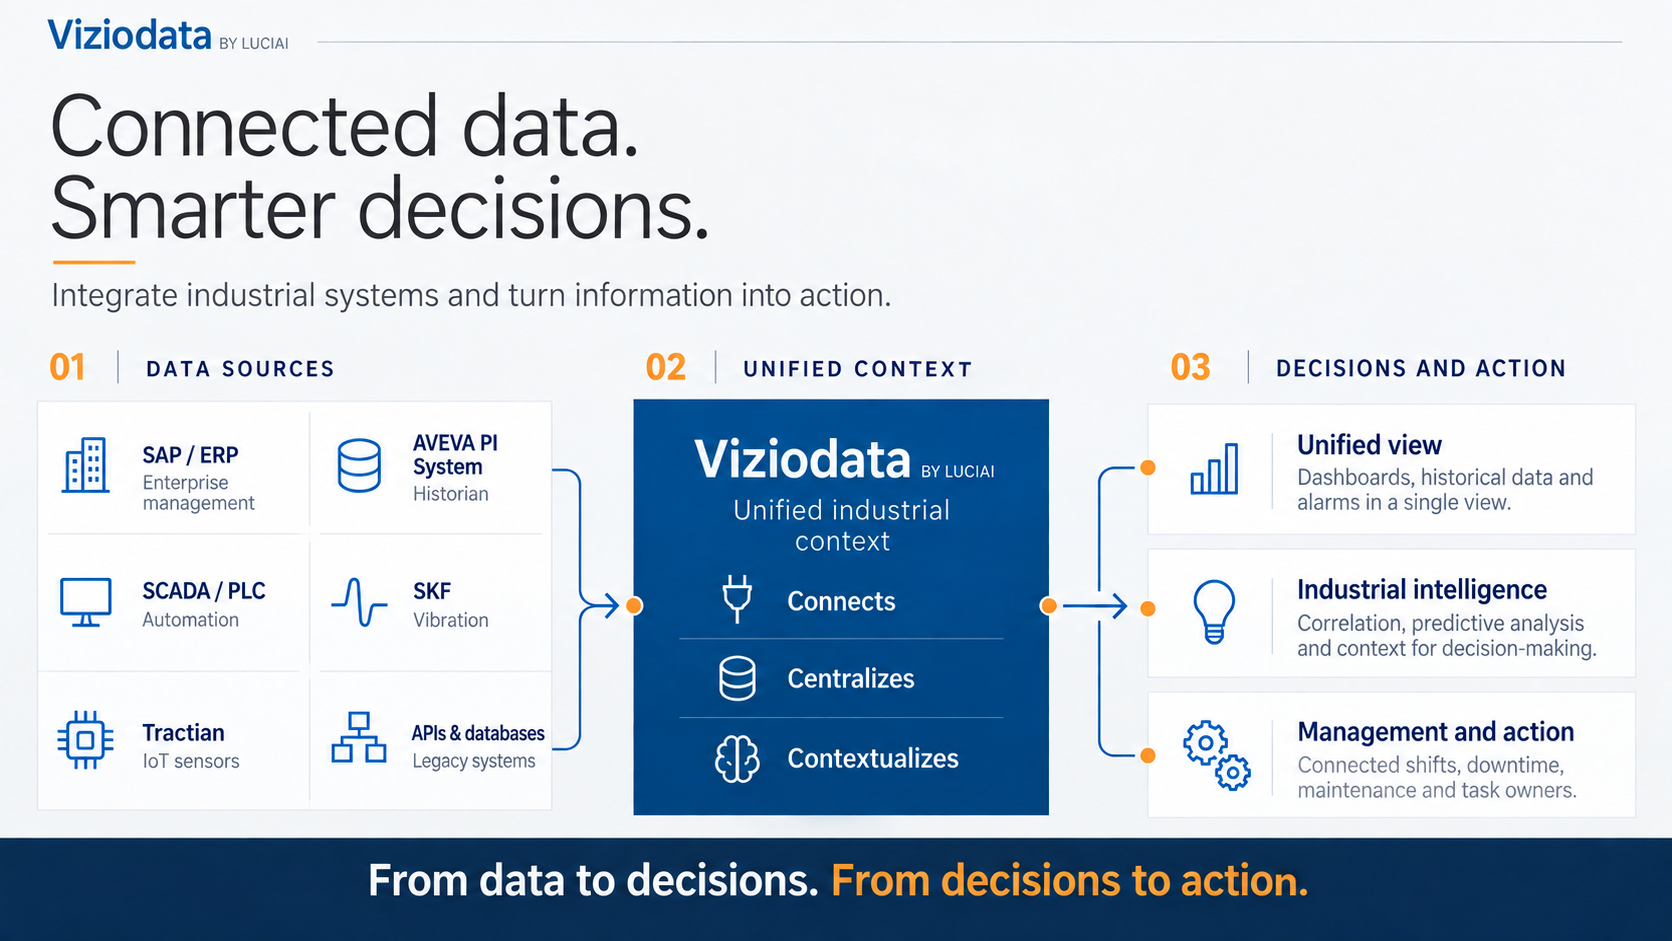
Industrial integration hub
Connected sources. Context for every team.
Bring data from different sources into the context of the plant, area and machine. Dashboards, alarms, shift logs and maintenance work with that shared context.
Your challenge is the starting point
Where does your operation need more clarity?
From shift routines to machine analysis: find the features that help your team take the next step.
What needs the next shift’s attention?
Record what happened, what was referred for action and what still needs follow-up.
Explore the solutionIs machine data scattered?
Follow machines and compare variables with dashboards and trends.
Explore the solutionHow can you investigate asset condition?
Explore vibration spectra and fault frequencies to support diagnosis.
Explore the solutionWhich loops need attention?
Observe saturation, oscillation and loop health rankings.
Explore the solutionFailure analysis in practice
From event to action plan. With the reasoning recorded.
A failure calls for investigation, action and follow-up. Viziodata organizes these stages and brings the information together in a technical report.
- 01
Describe the event
Record the problem and gather the context of the failure.
- 02
Connect the hypotheses
Organize probable causes and investigation plans in a visual flow.
- 03
Document the actions
Follow recurrence prevention plans and preventive actions in the report.
The path from causes to actions.
See how the analysis connects hypotheses, investigations and action plans.
Explore the complete flow ↗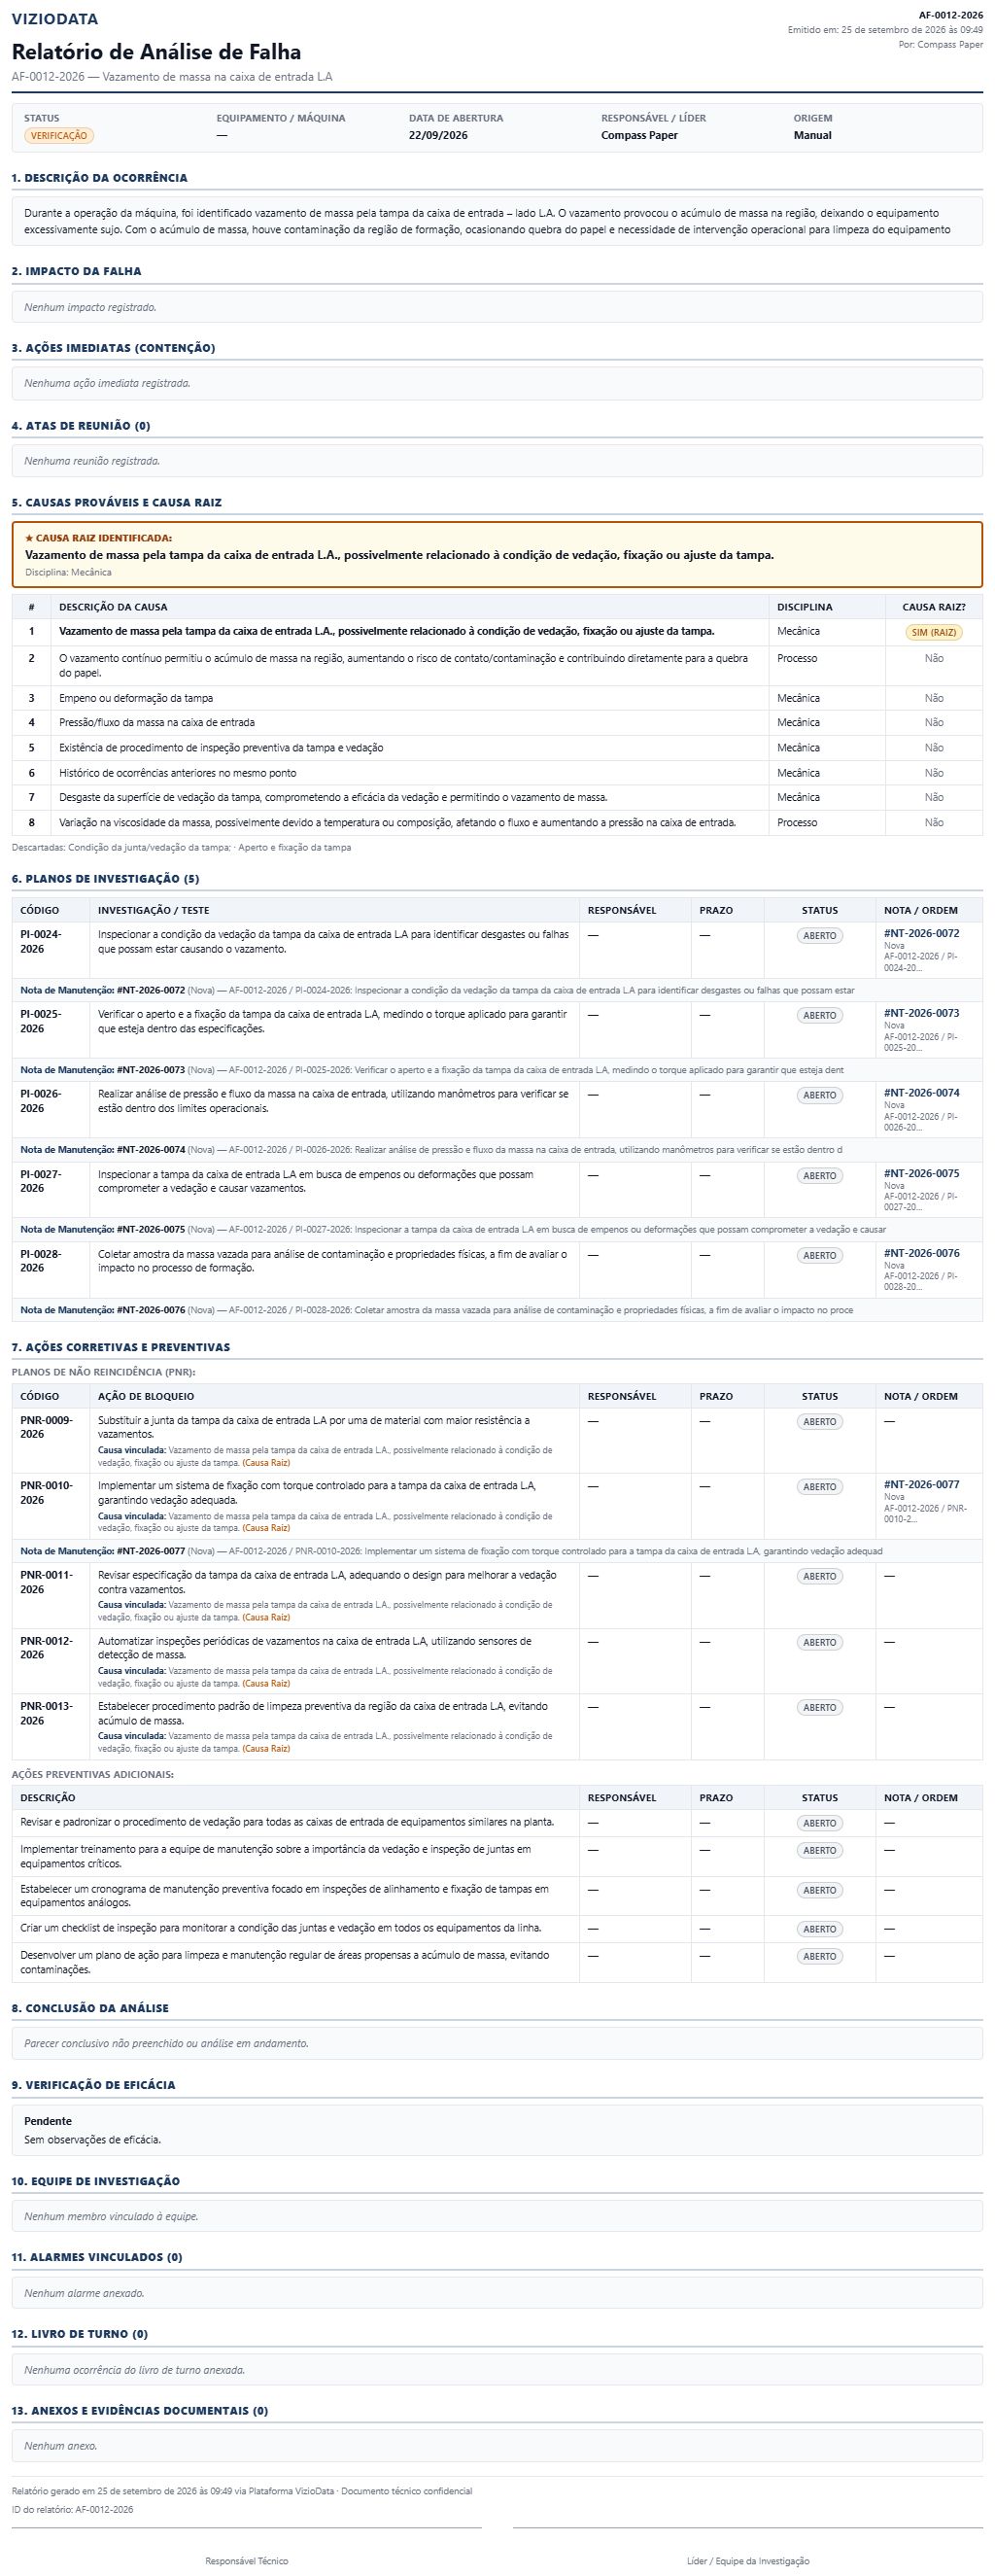
The analysis becomes a document.
A complete report with 13 sections, from the failure record to its evidence.
Read the complete report ↗Use cases
From the paper machine to the IT room: see Viziodata in use
Explore scenarios for pulp and paper, predictive maintenance, PID loops, data centers, HVAC and sugar mills. Each case connects a challenge to platform features.
From the paper machine to the next shift
See case →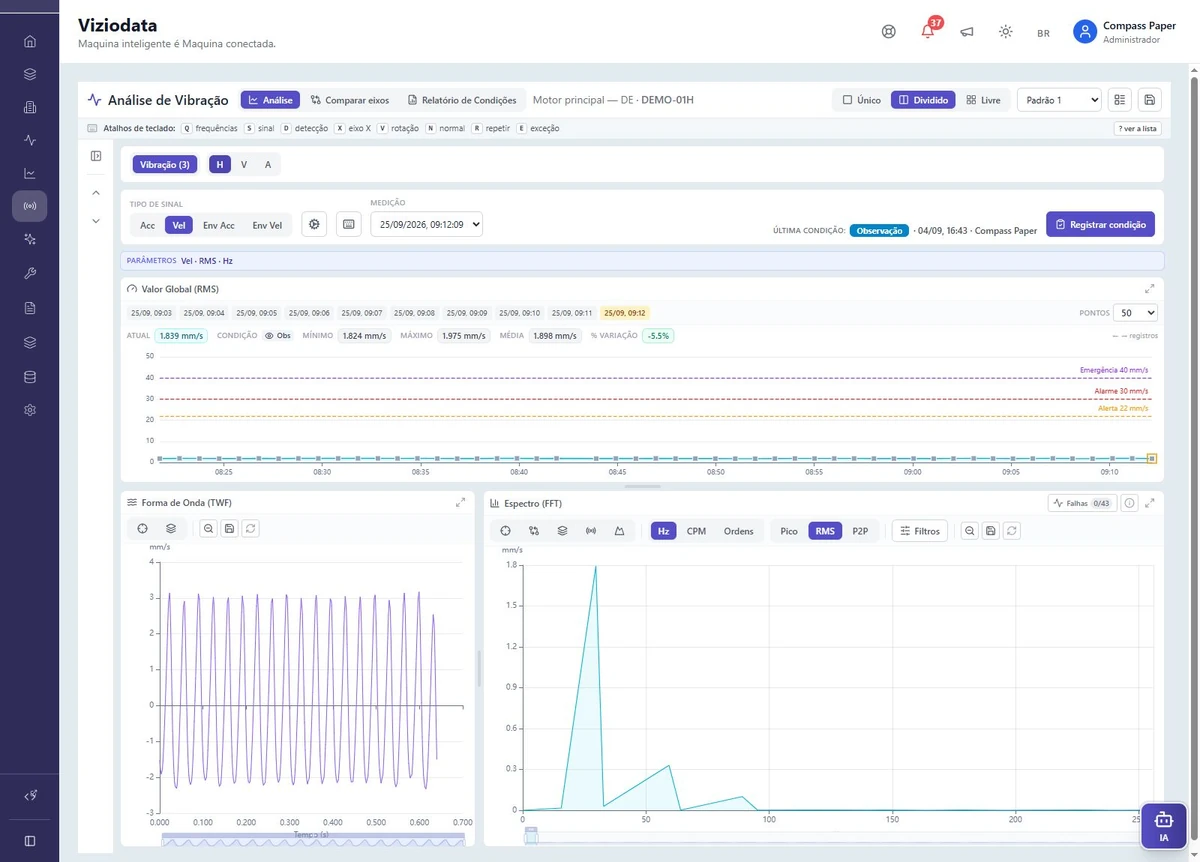
Investigate main motor vibration
See case →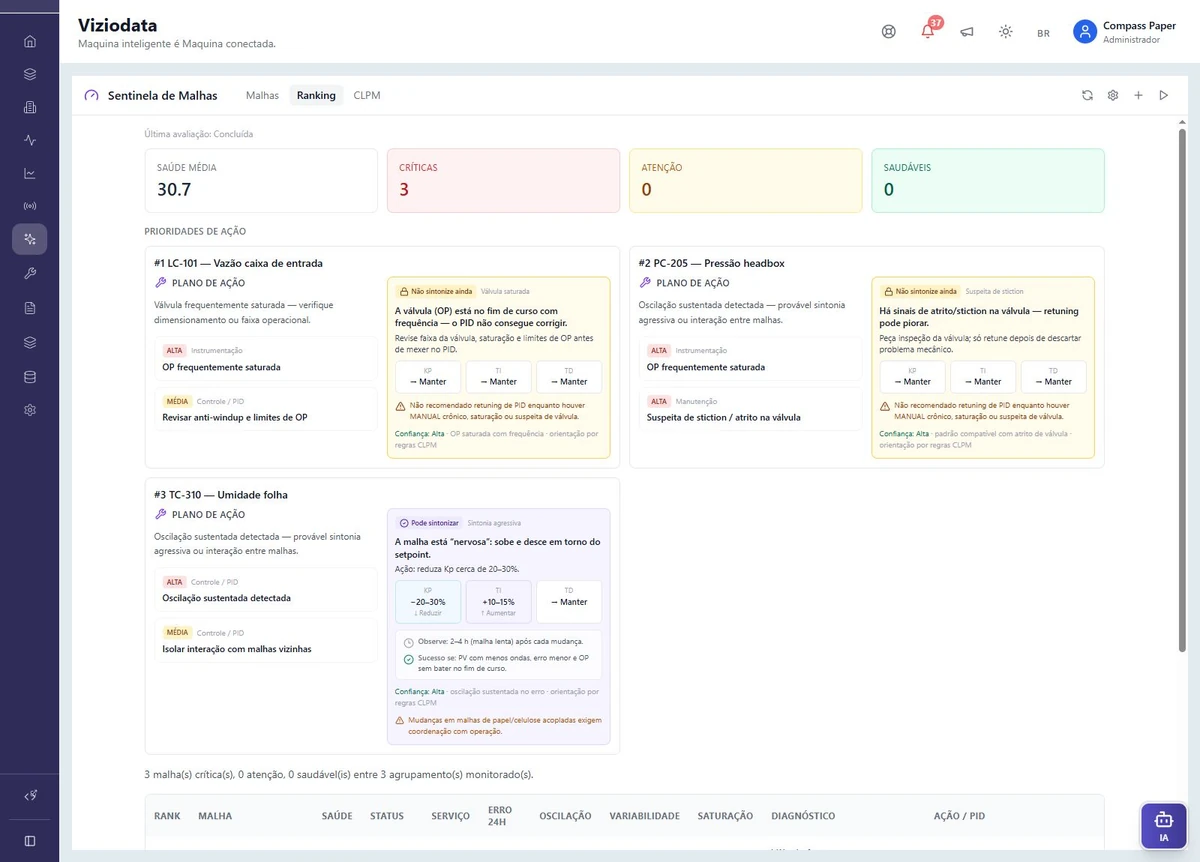
Prioritize flow, pressure and moisture loops
See case →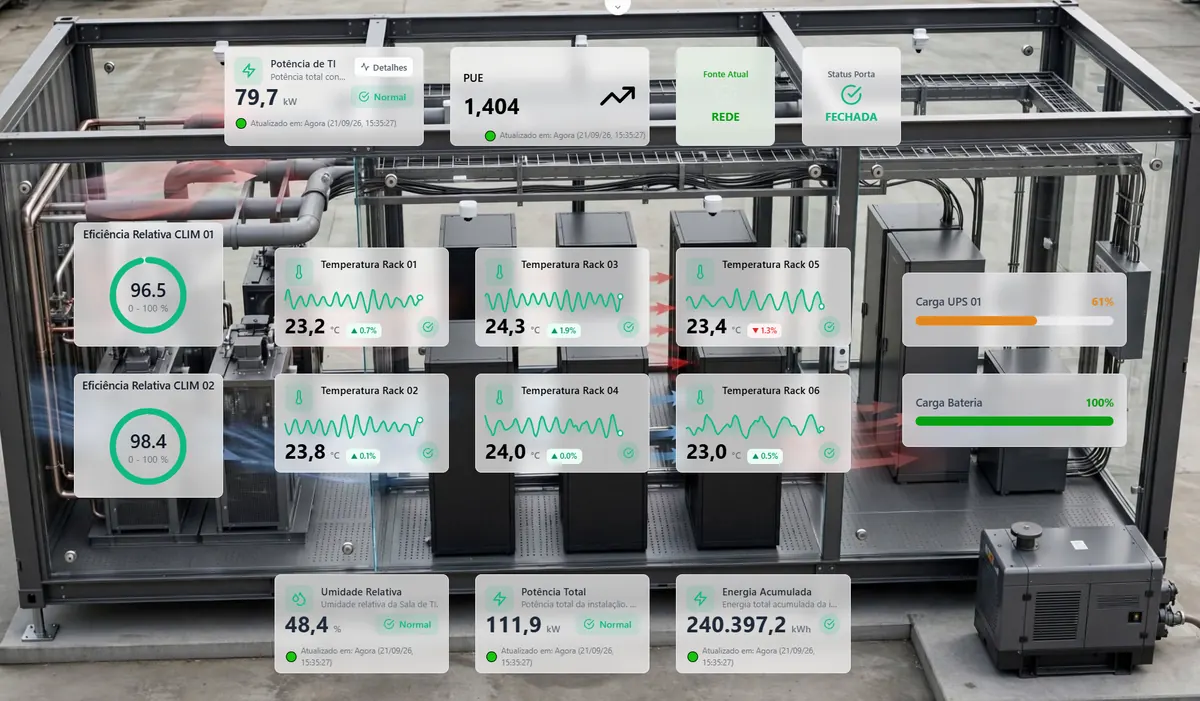
IT room, PUE and racks
See case →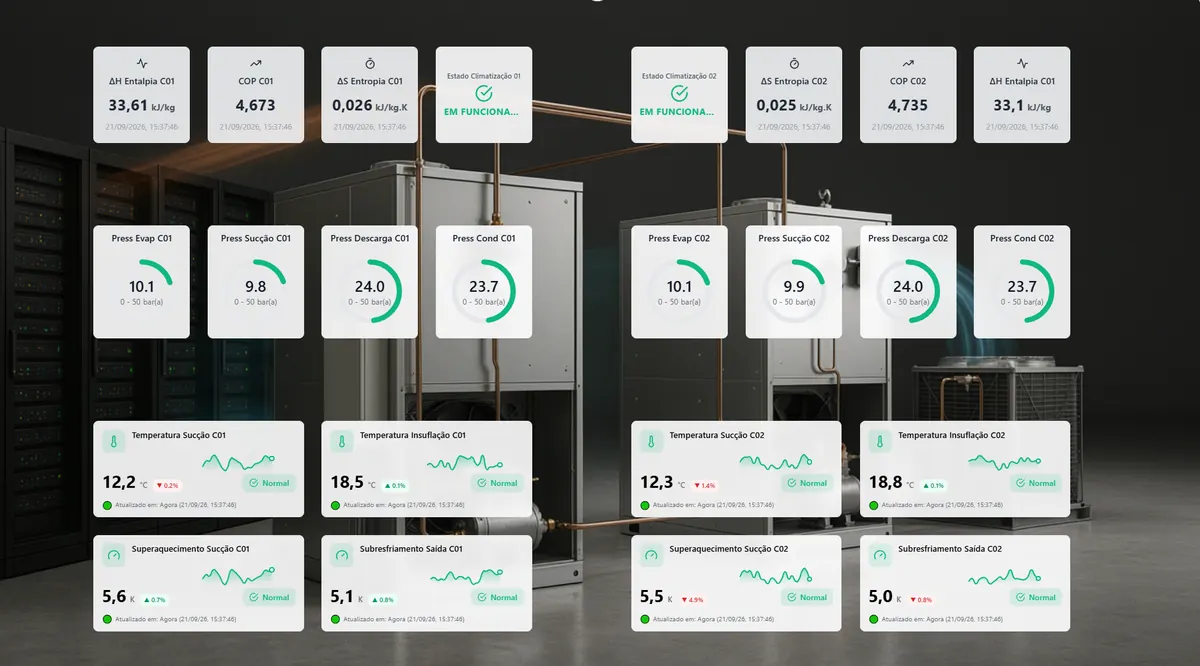
COP and two-chiller cycle
See case →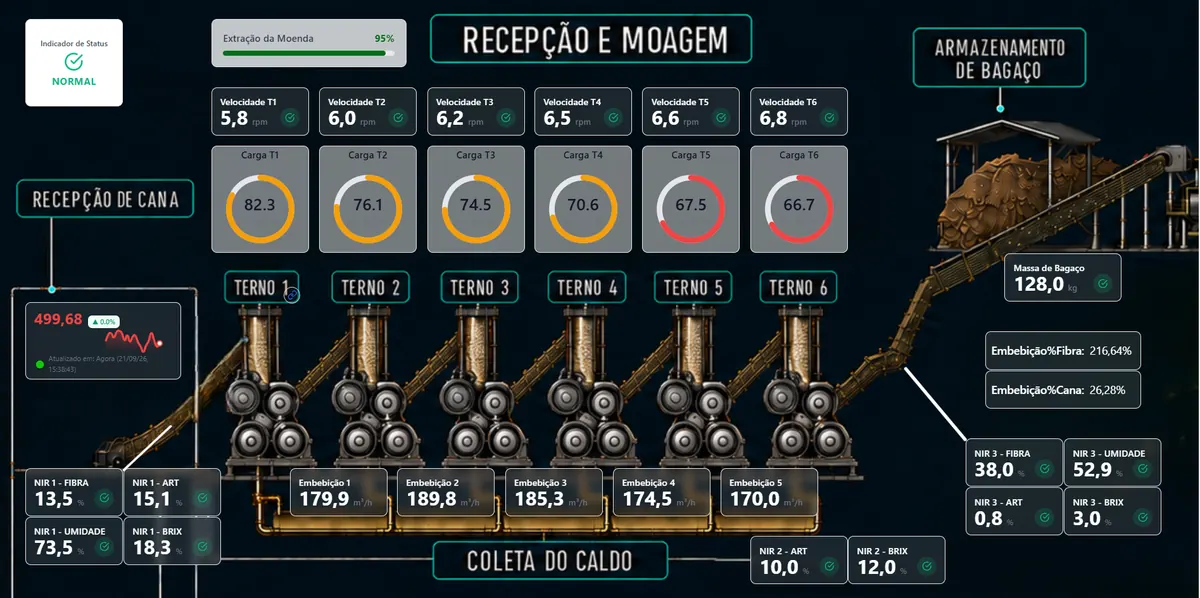
Intake, rollers and imbibition
See case →FAQ
What to know before getting started
Understand the product and the next steps for your operation.
What does using Viziodata as an industrial integration hub mean?
It means bringing data from sources such as MQTT, APIs and Excel into asset context and connecting that history to dashboards, alarms, shift logs and maintenance. Teams can relate process events to operational records and follow-up actions. Compatibility is assessed for each data source and project.
Who is Viziodata for?
Operations, maintenance and engineering teams that need to monitor industrial variables, record events, investigate failures and share asset context.
Do I need to connect the entire plant to start?
The discussion can start with one machine, an area or a process such as shift handover. During the demo, we assess the features and integrations needed for that scope.
Can I use data I already have?
The platform offers integration and import features, including MQTT, API and Excel. Compatibility depends on available sources and connectivity; bring this information so we can assess your scenario.
What will I see in the demo?
You describe your operational challenge, and the team shows the relevant product features. These may include dashboards, shift records, vibration analysis or loop diagnostics. We then discuss scope and next steps.
How do I get a proposal for my operation?
Request a demo through the form or contact us on WhatsApp. If available, share the areas, assets and data sources you want to include. These details help define the proposal; you do not need a fully defined project to start the conversation.
See it in your operation
Which challenge shall we look at first?
Bring a real operations, maintenance or engineering challenge. The demo shows how to work with it in Viziodata.
- 01
Tell us your scenario
We discuss your routine and what you want to improve.
- 02
See the relevant features
We present the product with a focus on your challenge.
- 03
Evaluate next steps
Together we define scope and integration requirements.
Request a demo
Tell us what you want to improve. You do not need a sensor count or a defined project to get started.