Alarm Treemap
Hierarchical map of severity and occurrence. Shows which assets concentrate events and where the operation should look first.
Platform view
Bring process data, operational records and maintenance into the context of each asset. Connect MQTT and API sources, import history from Excel and use that data to follow your operation.
Industrial integration hub
Bring data from different sources into the context of the plant, area and machine. Dashboards, alarms, shift logs and maintenance work with that shared context.

Connected operation
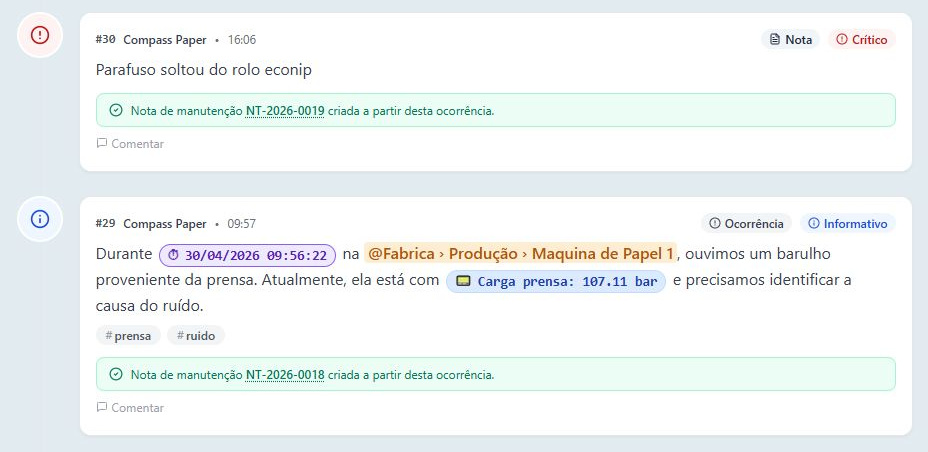
An event needs to reach the next shift with enough information to act. The Shift Log brings together the report, the machine involved, readings and the maintenance referral.
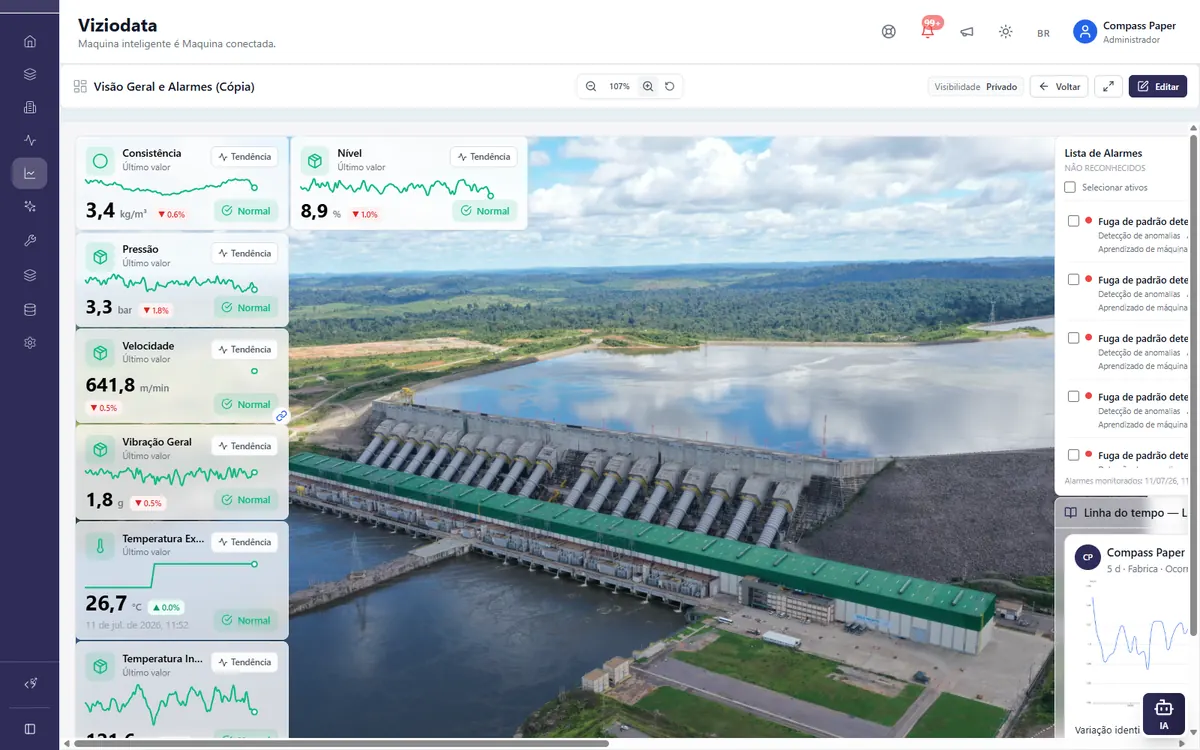
Plant dashboard
Process KPIs, unacknowledged alarm list and timeline on the same panel — ready for the control room and managers.
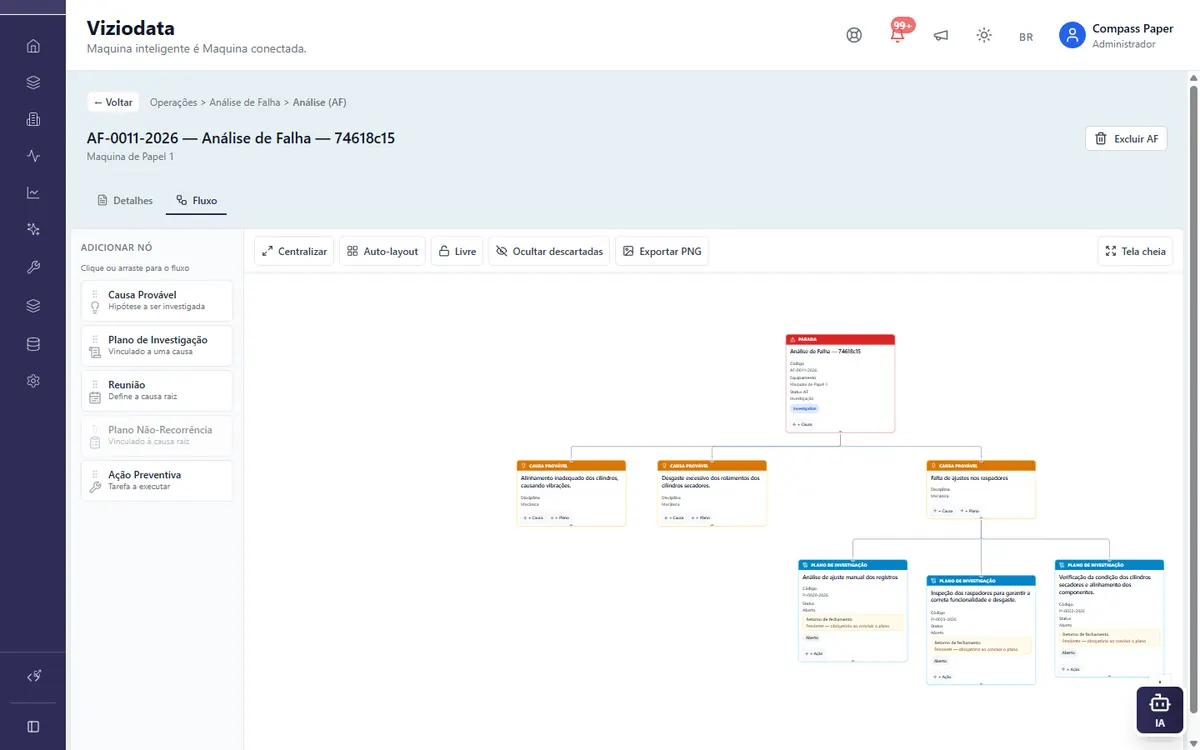
Failure Analysis
Cause diagram, investigation plans and preventive actions — from the stoppage to effectiveness verification.
Process intelligence
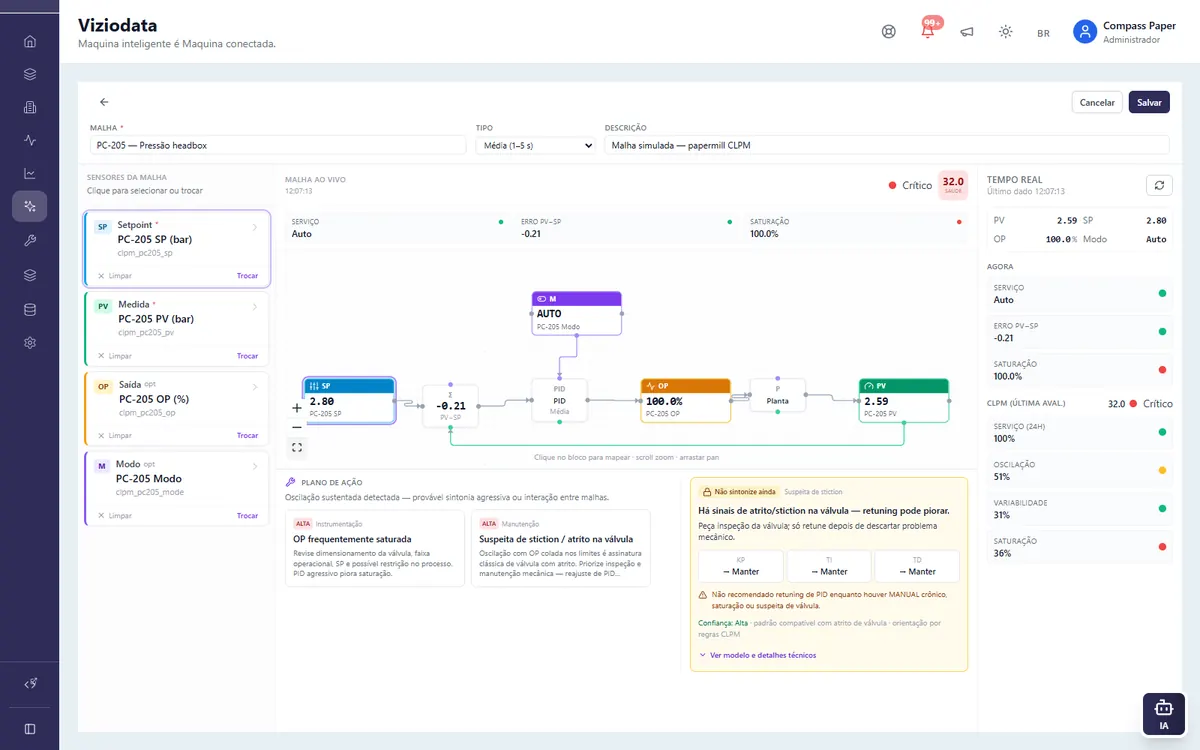
PID loop monitoring (health, saturation, oscillation) and a multi-panel Trend Analyzer in the same ecosystem.
Industrial intelligence
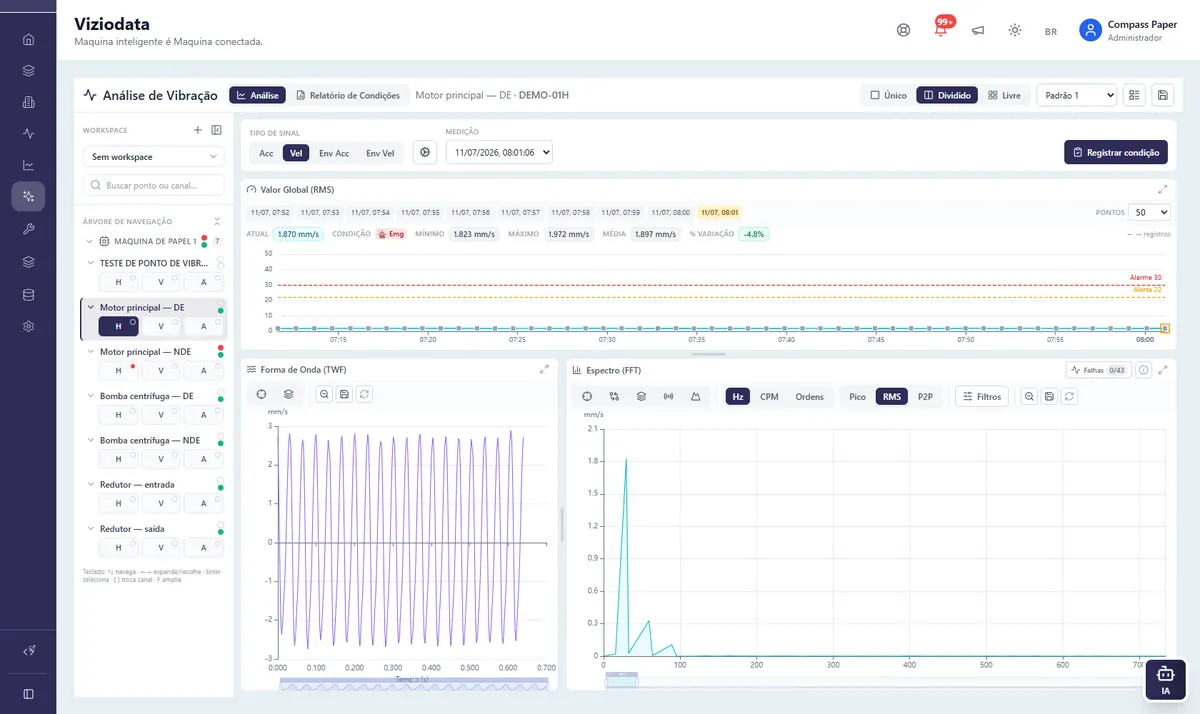
Vibration analysis with TWF and FFT, failure frequencies and per-point history — all linked to hierarchy assets.
Machine learning
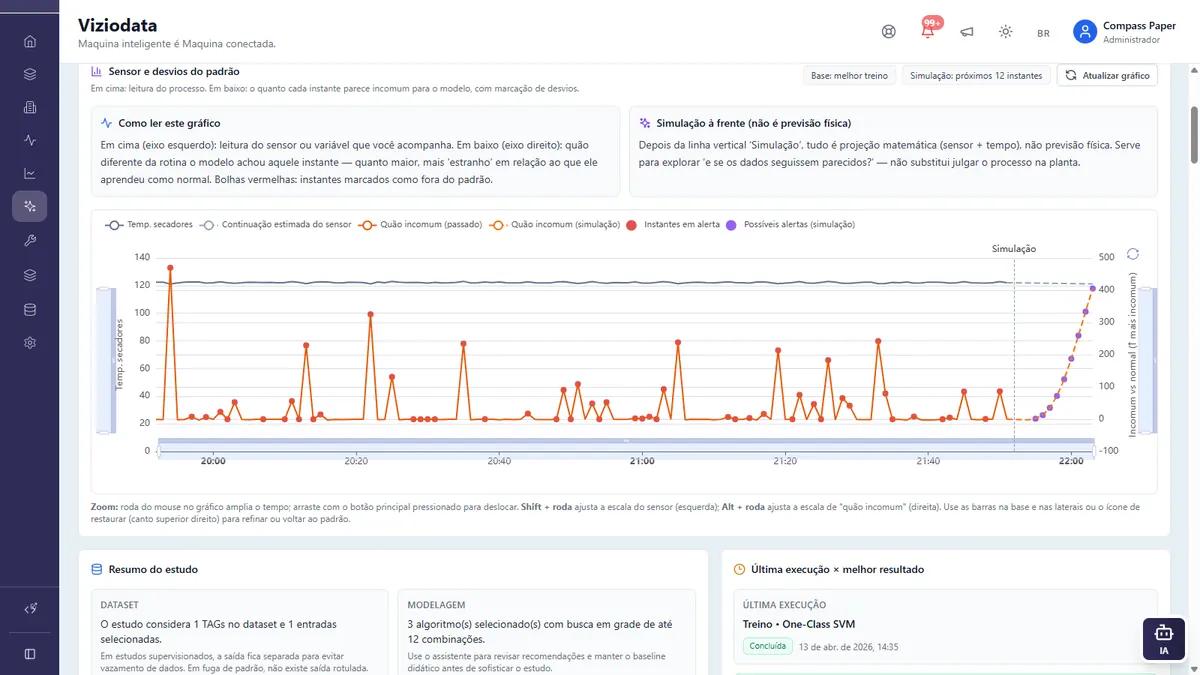
Study 01 with One-Class SVM: sensor series, unusual-vs-normal score and red markers at the moments outside the expected pattern.
Platform news
The new flows connect priority, analysis and execution without leaving the plant model.
Hierarchical map of severity and occurrence. Shows which assets concentrate events and where the operation should look first.
Master database in the spirit of ISA-18.2, with cause, consequence, operator action, approved setpoint and revision history.
Visual score to prioritize predictive analysis, with vibration, failure frequencies, wireless inventory and SKF data on the same asset.
Use cases
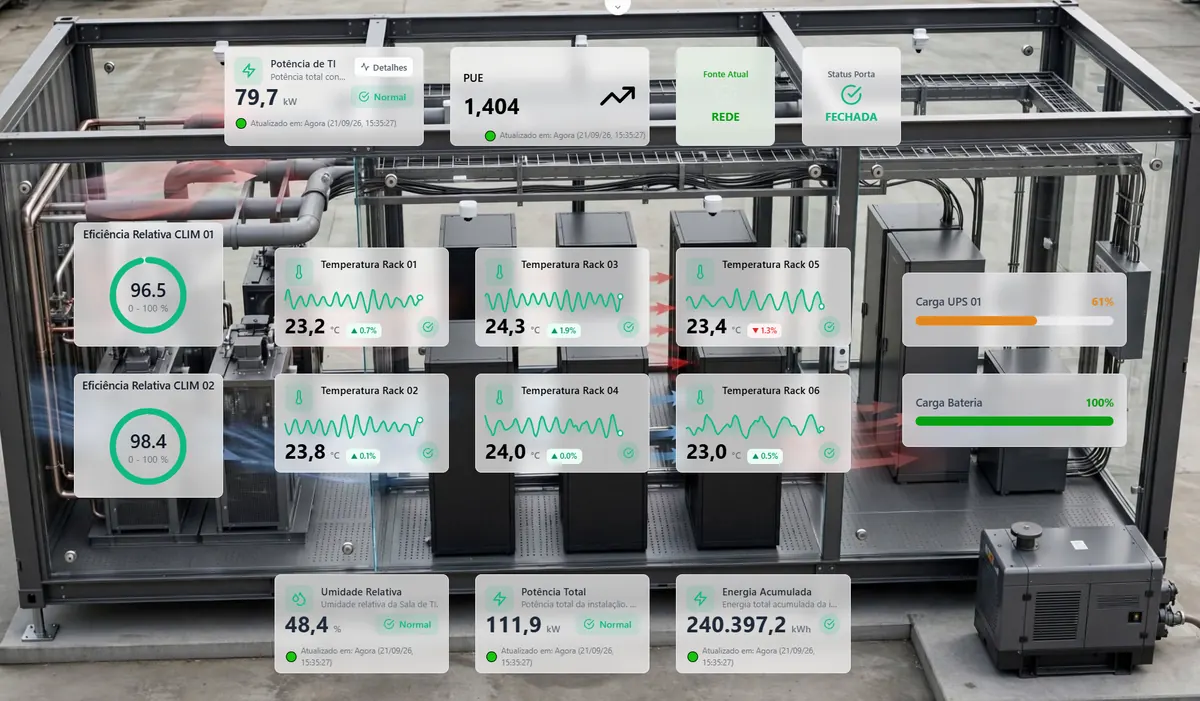
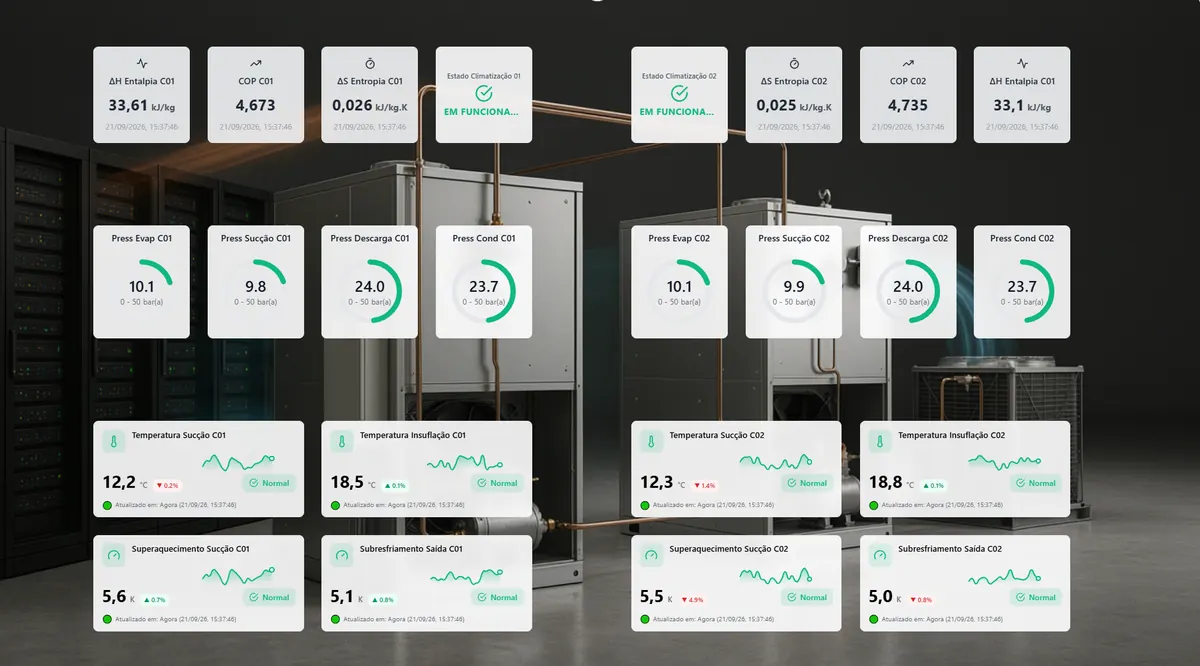
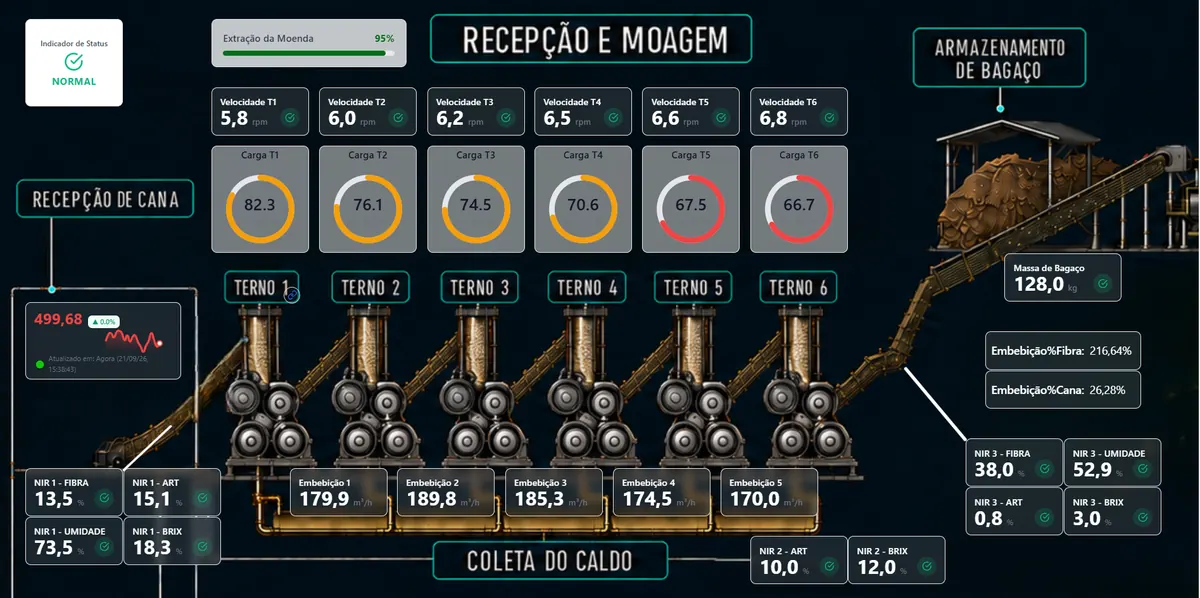
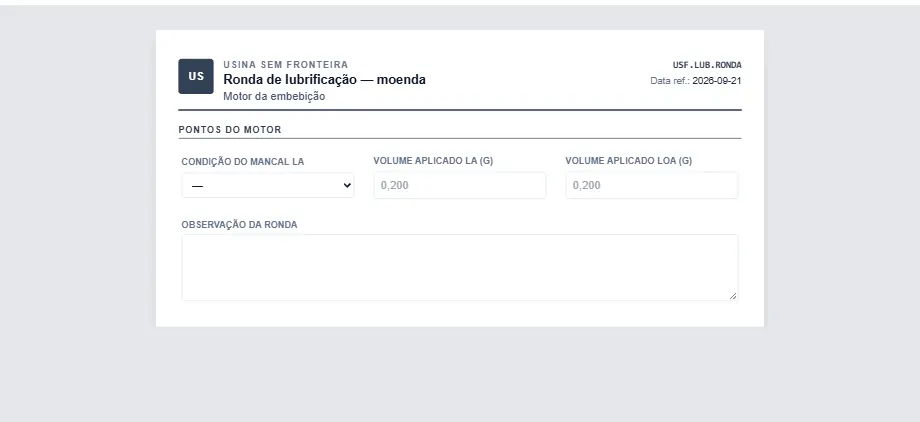
Data center, HVAC and mill use the same dashboard: gauges, status and series over the asset image.
Maintenance engineering
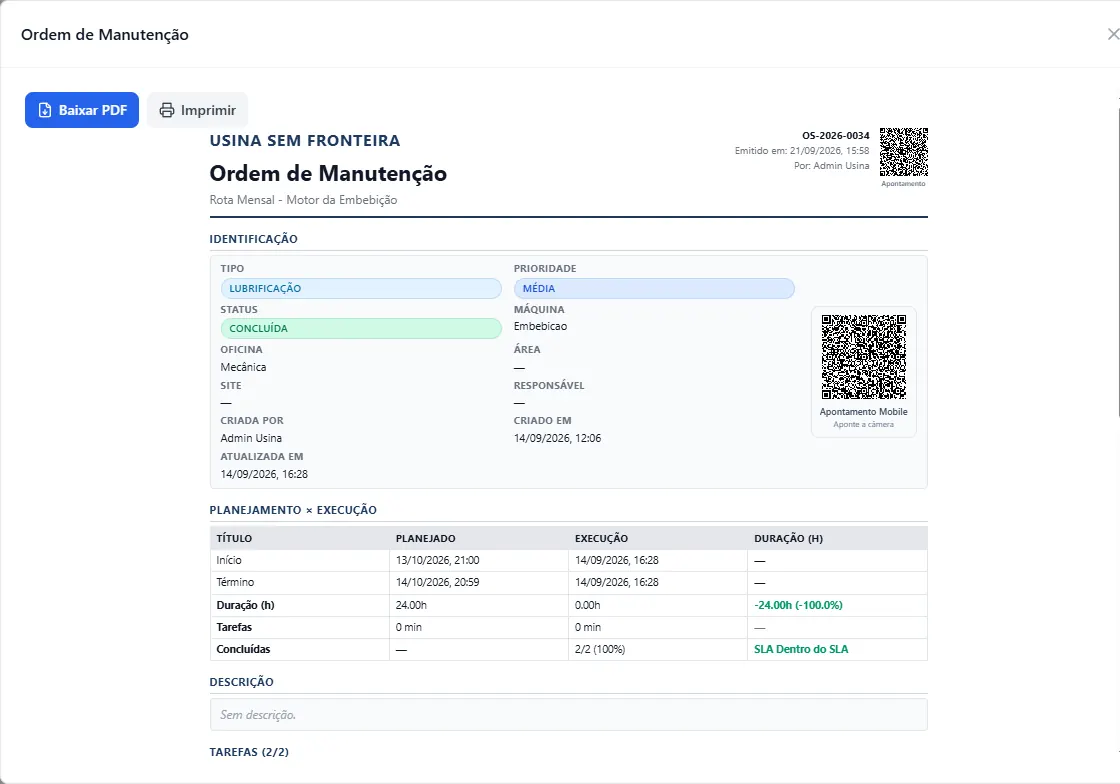
Preventive plan by calendar or sensor, inspection route and lubrication route with volume and telemetry. The work order ships with workshop, tasks and QR Code.
Reports and forms
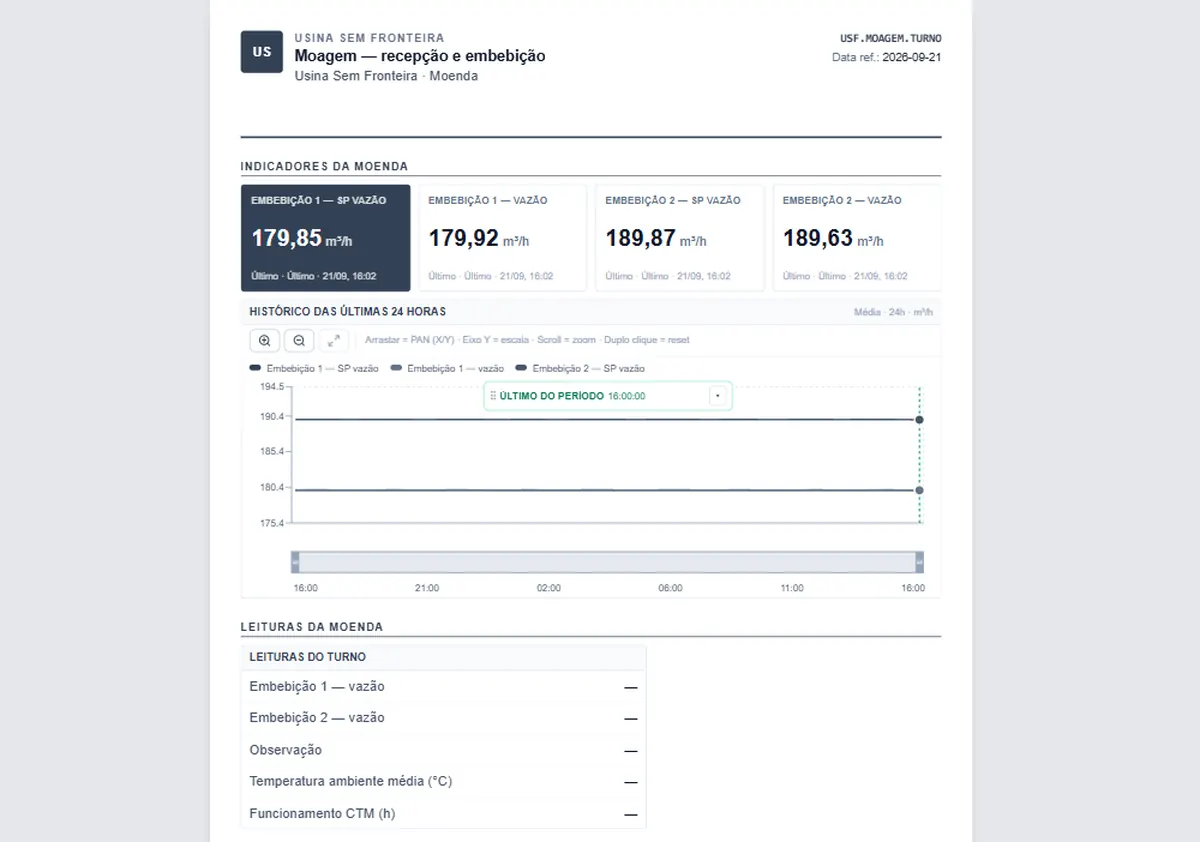
Build reports with plant data and create field forms with internal or public-link completion.
Operational flow
Viziodata connects data, analysis and execution in a single flow for each team.
Sensors, connectors and manual entries record the reality of the operation.
Alarms, indicators and analyses organize the most important signals.
Dashboards, trends and TV panels give context to operation and management.
Shift, maintenance, Failure Analysis and AI Assistant turn data into action.
Connected operation
Connect industrial sources and deliver useful information to those who decide and execute.
Definition
Viziodata organizes the plant as Company → Site → Area → Machine → Sensor (Tag) and unites real time, history, alarms, maintenance, shifts and AI in the same data model — complementing SCADA/PLC with a multi-site operational portal.
How it works
Understand the product and the next steps for your operation.
In a multi-company hierarchy: Company → Site → Area → Machine → Sensor (Tag). This structure is the single source of truth for real time, history, alarms and operational collaboration.
Not necessarily. Viziodata complements SCADA/PLC by consolidating data, shifts, KPIs, maintenance and AI in a multi-site operational portal, with connectors (e.g. MQTT) and totalization.
Yes. It includes Machine Learning, Correlation, Loop Sentinel, Vibration Analysis and an AI Assistant to summarize evidence and support process and reliability decisions.
It is a digital shift record with templates per area, events, hashtags, timeline and TV panel — linked to alarms, maintenance and the AI assistant for continuity across shifts.