Dashboards
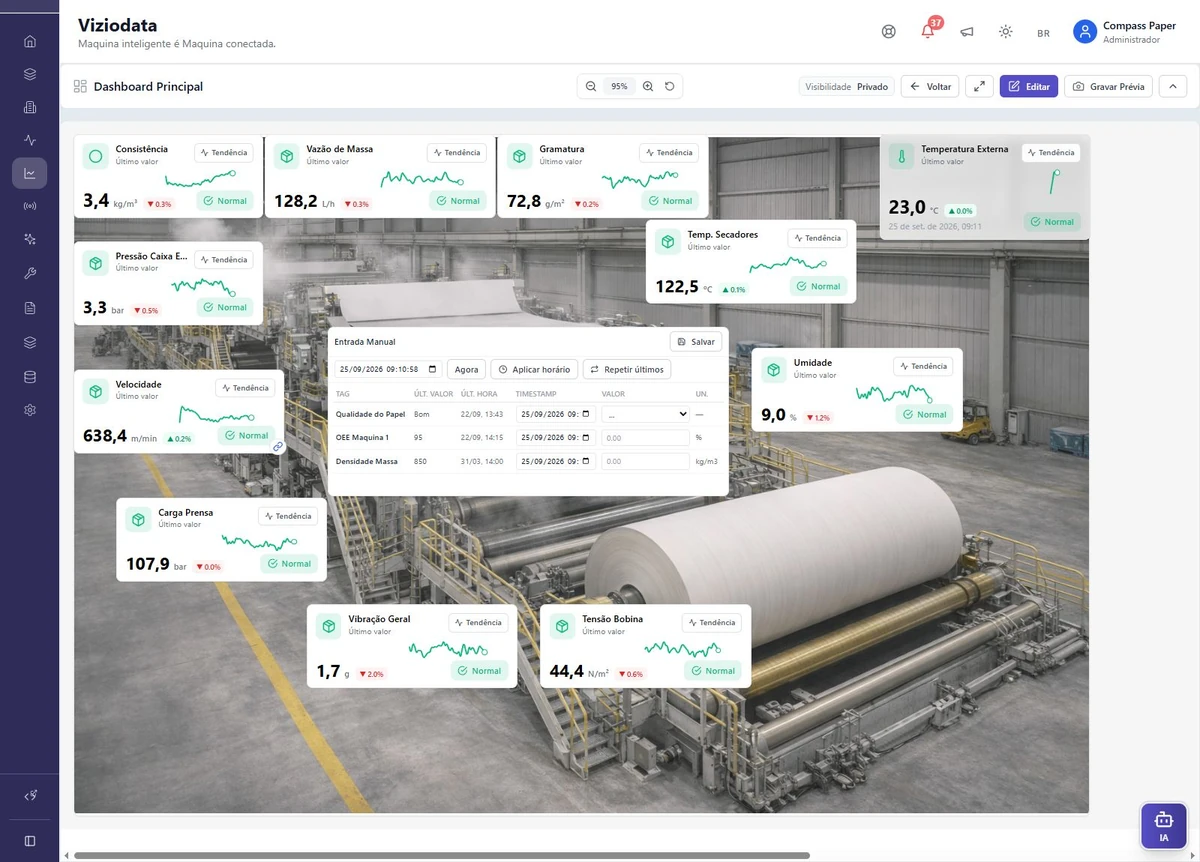
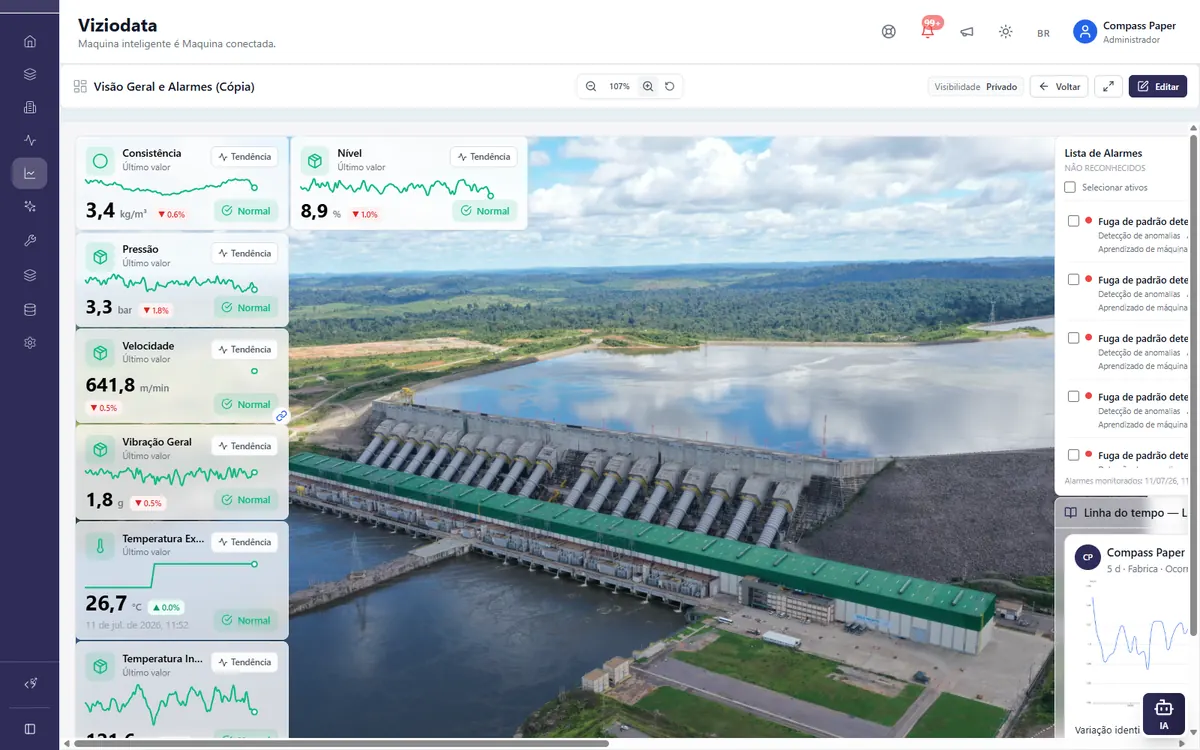
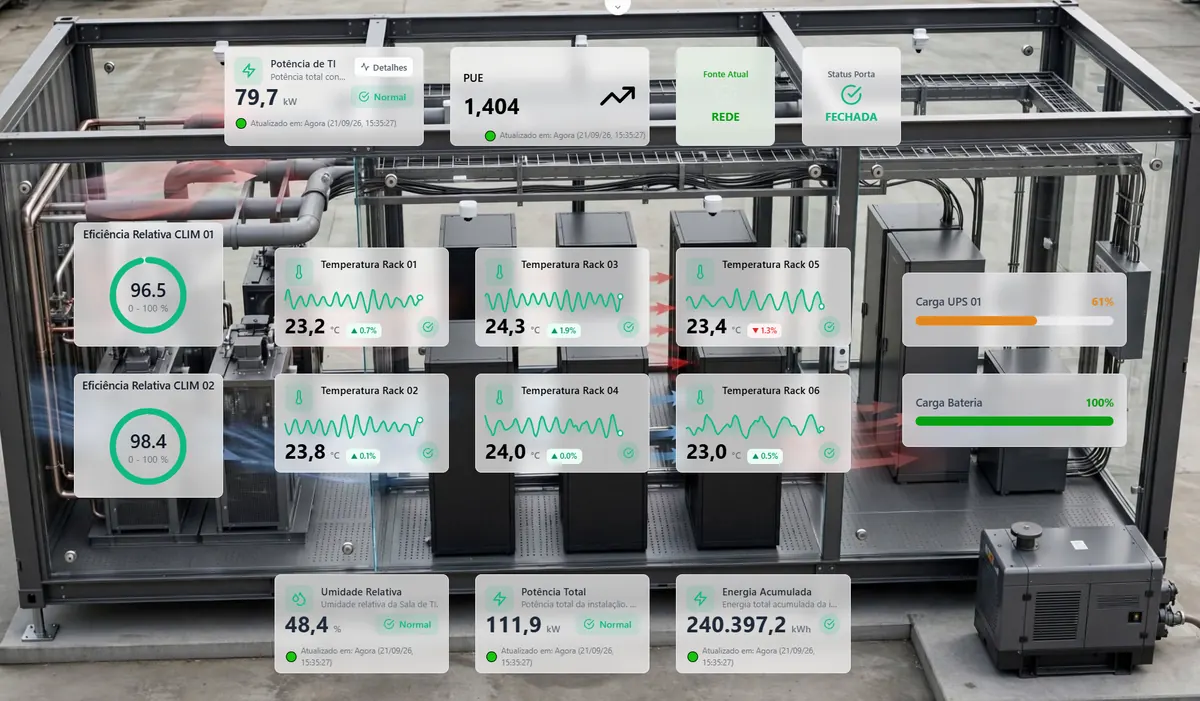
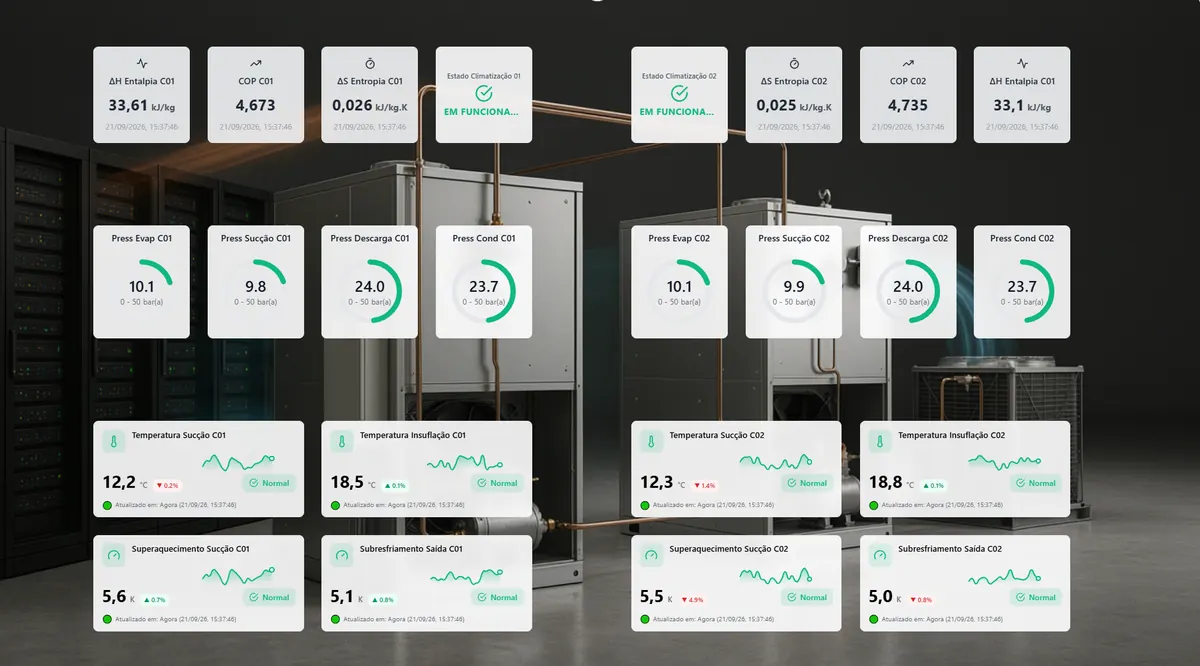
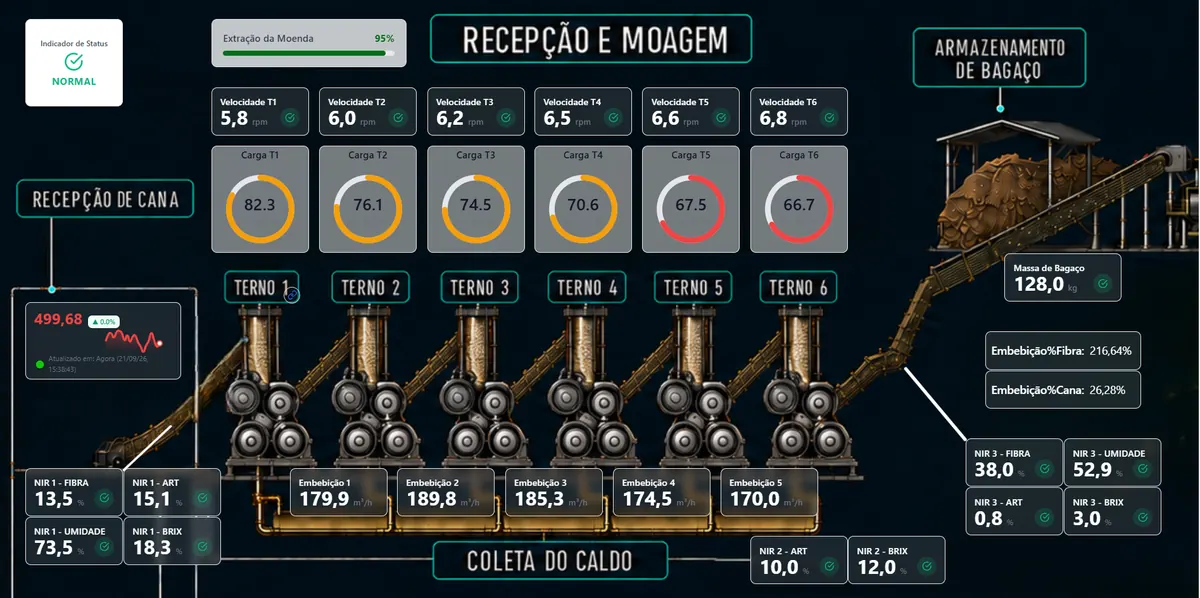
Editor with gauges, charts, alarms, map, industrial tank and image with layers. Public link by token.
Actionable insights
Dashboards, alarm treemap, trend analyzer, derived points and totalization.
Overview
Viziodata's Analysis group: turn time series into panels, comparisons, derivations and industrial indicators.
Modules
Editor with gauges, charts, alarms, map, industrial tank and image with layers. Public link by token.
Heat map of alarm severity and occurrence per asset.
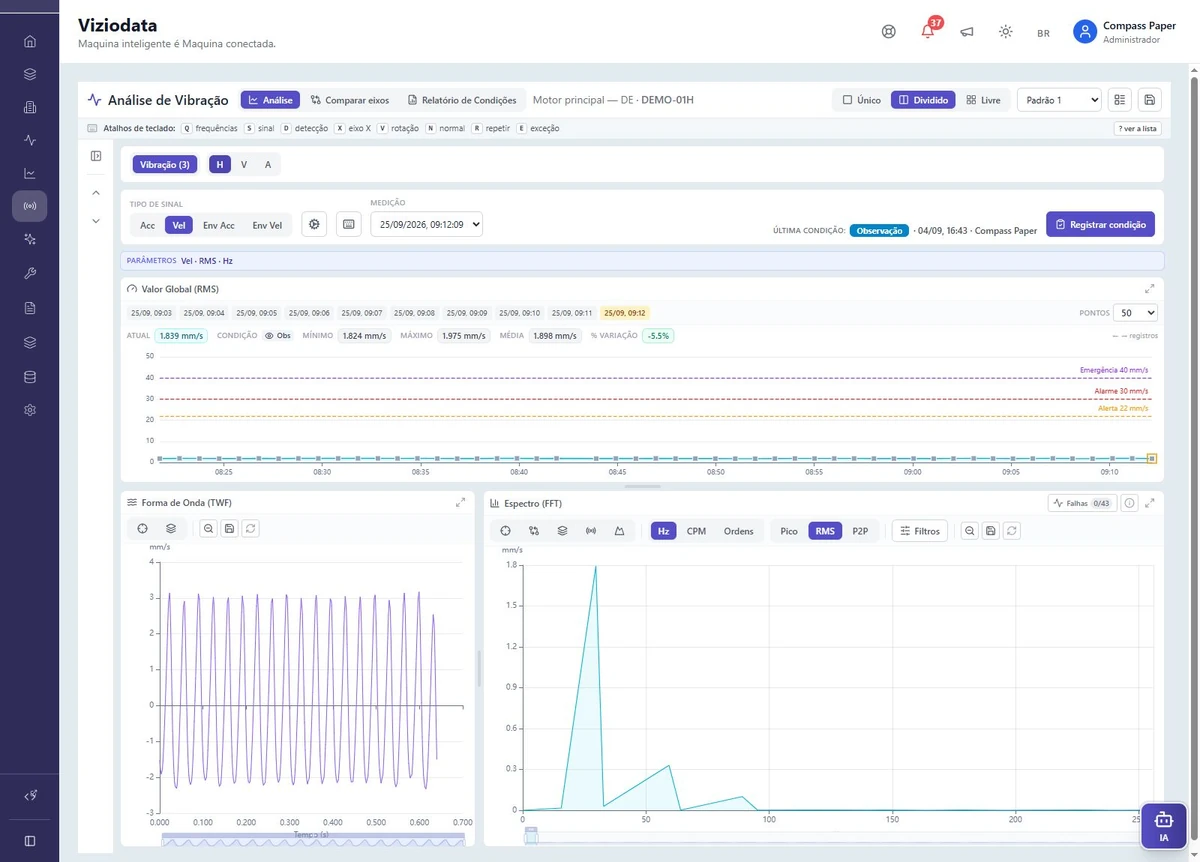
Trend Analyzer: multi-panel, tag comparison, windows and public series links.
Percentage derivatives, max, min, average and deviation — fixed and rolling windows.
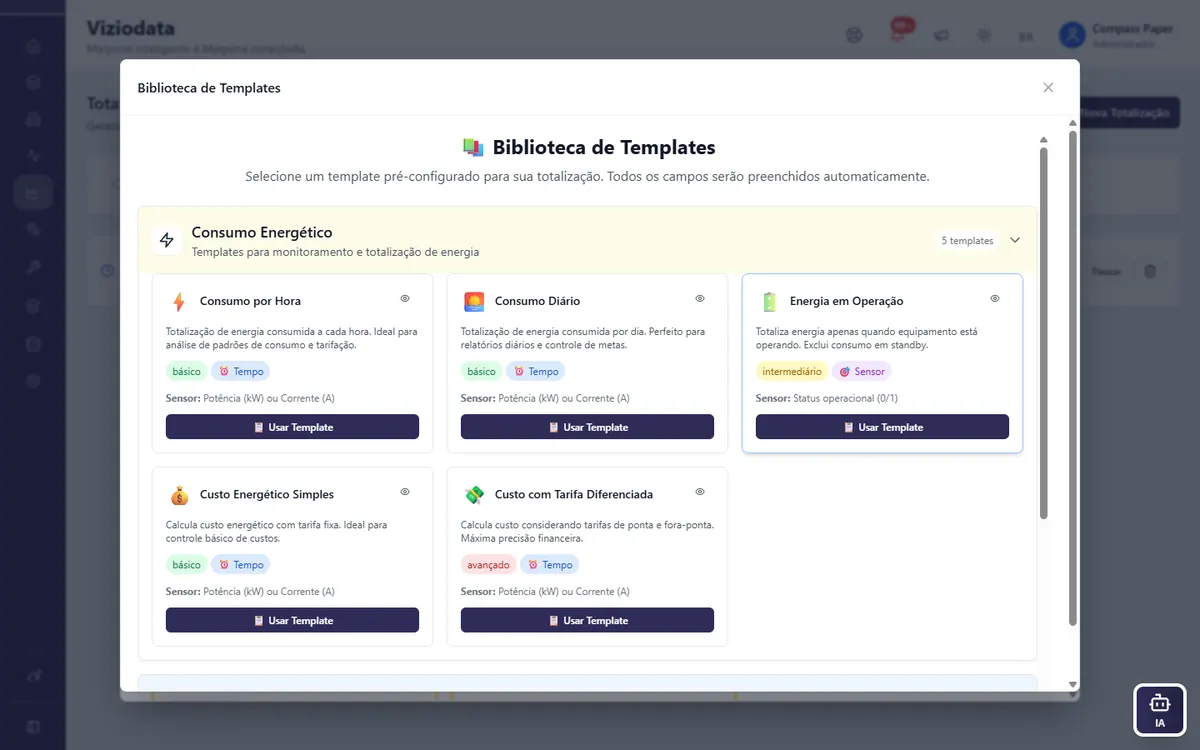
SUM, COUNT, AVG, INTEGRAL, energy and KPI templates per industry.
Industries
Cross applications — the same modules in different industrial contexts.
Case studies
Application
Understand the product and the next steps for your operation.
Viziodata's Analysis group: turn time series into panels, comparisons, derivations and industrial indicators.
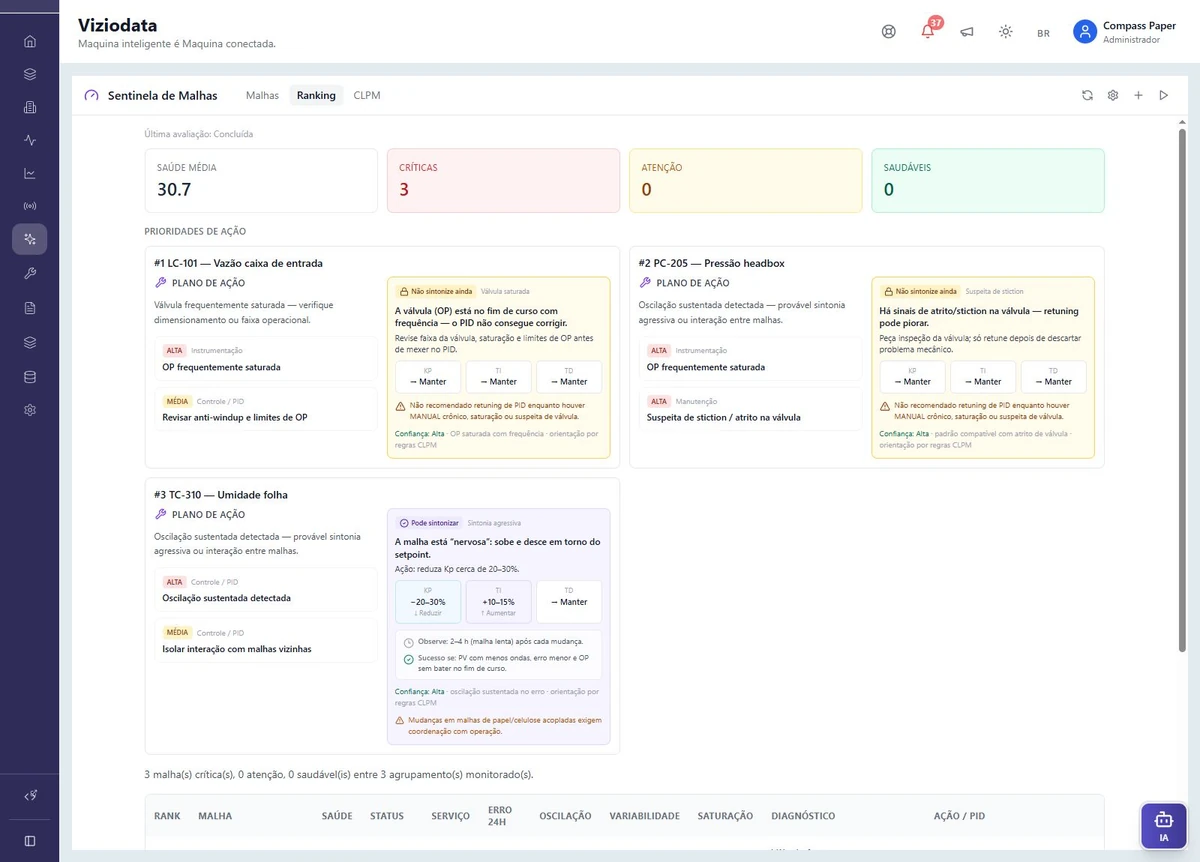
The Analysis area includes: Dashboards, Alarm Treemap, Trend Analyzer, Derived Points, Totalization.
Shift, daily and monthly KPIs in one place Fast comparison between lines, areas and sites TV panels and public links for control rooms