Luciai demonstration scenario — illustrates the module combination, no named customer.
Challenge
The problem at the plant
COP, pressures and suction temperatures stayed on field screens. The shift did not see superheat and subcooling together.
Solution
How Viziodata came in
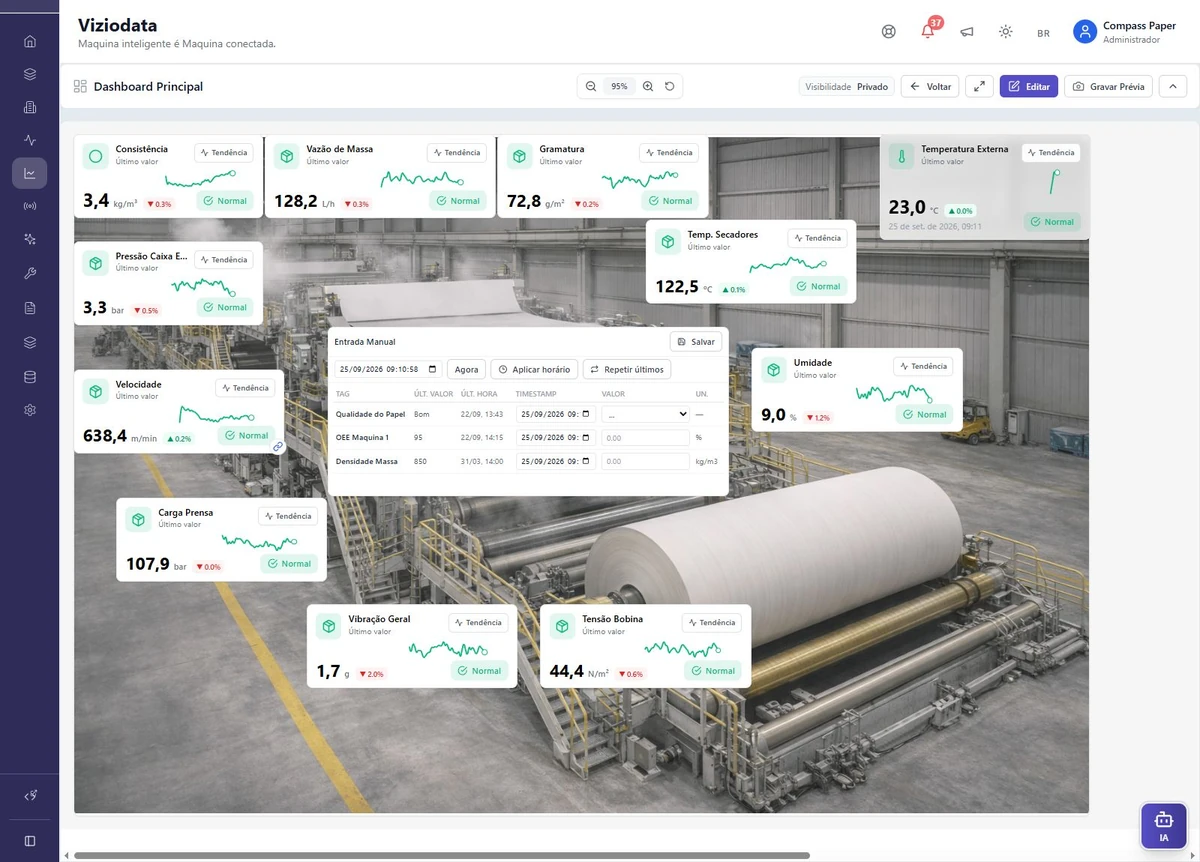
The dashboard gathers, for each chiller, COP, enthalpy, evaporation and discharge pressures, temperatures and the superheat/subcooling pair, with equipment status.
Results
What changed
- Two circuits side by side
- COP and pressures with status in real time
- Superheat deviation visible on the panel
“The chiller cycle fits in a single reading, not a round of screens.”